ETFOptimize | High-performance ETF-based Investment Strategies

Quantitative strategies, Wall Street-caliber research, and insightful market analysis since 1998.


ETFOptimize | HOME
Close Window

Do Wall Street Analysts Like Henry Schein Stock?

With a market cap of $8.4 billion, Henry Schein, Inc. (HSIC) is a leading global provider of healthcare products and services, primarily serving dental and medical practitioners. The New York-based company operates through a large distribution network, offering supplies, equipment, pharmaceuticals, and value-added solutions, such as practice management software, consulting, and digital dentistry technologies.

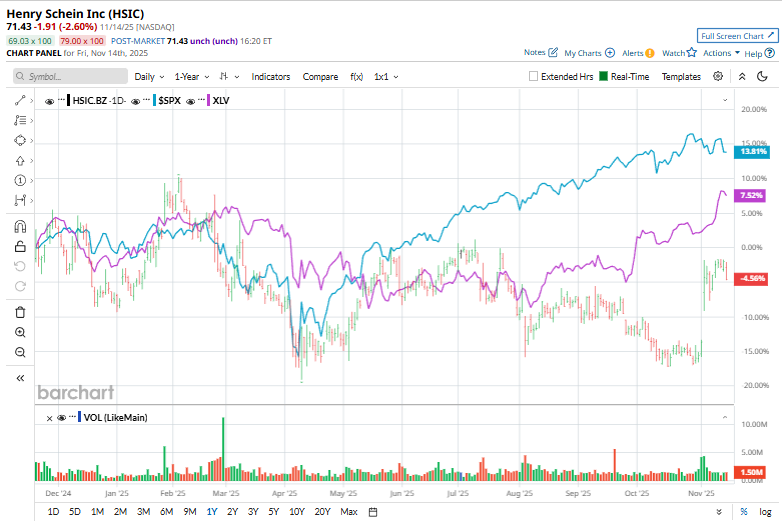
Shares of HSIC have underperformed the broader market over the past 52 weeks. HSIC stock has surged 7.4% over this time frame, while the broader S&P 500 Index ($SPX) has gained 13.2%. Moreover, shares of the company have climbed 3.2% on a YTD basis, compared to SPX's 14.5% rise.


Looking closer, Henry Schein stock has outpaced the Health Care Select Sector SPDR Fund's (XLV5.1% drop over the past 52 weeks.

www.barchart.com

On Nov. 4, HSIC shares popped 10.8% after the company announced its third-quarter earnings that exceeded market expectations. The company posted revenue of $3.34 billion, up 5.2% year over year, with constant-currency internal growth of 3.3%. Segment performance was solid: Dental merchandise sales rose 4.6%, dental equipment increased 5.5%, medical distribution grew 4.7%, and technology solutions advanced 9.7%.

Non-GAAP EPS increased 13.1% to $1.38, and adjusted EBITDA reached $295 million, compared with $268 million in the prior-year period. Management raised its full-year 2025 non-GAAP EPS outlook to $4.88–$4.96 and now expects sales growth of 3–4%, reflecting higher confidence in execution.

For the fiscal year ending in December 2025, analysts expect HSIC's adjusted EPS to grow 3.6% year-over-year to $4.91. The company's earnings surprise history is mixed. It beat or met the consensus estimates in three of the last four quarters while missing on another occasion. 

Among the 15 analysts covering the stock, the consensus rating is a “Moderate Buy.” That’s based on five “Strong Buy” ratings, nine “Holds,” and one “Strong Sell.”

www.barchart.com

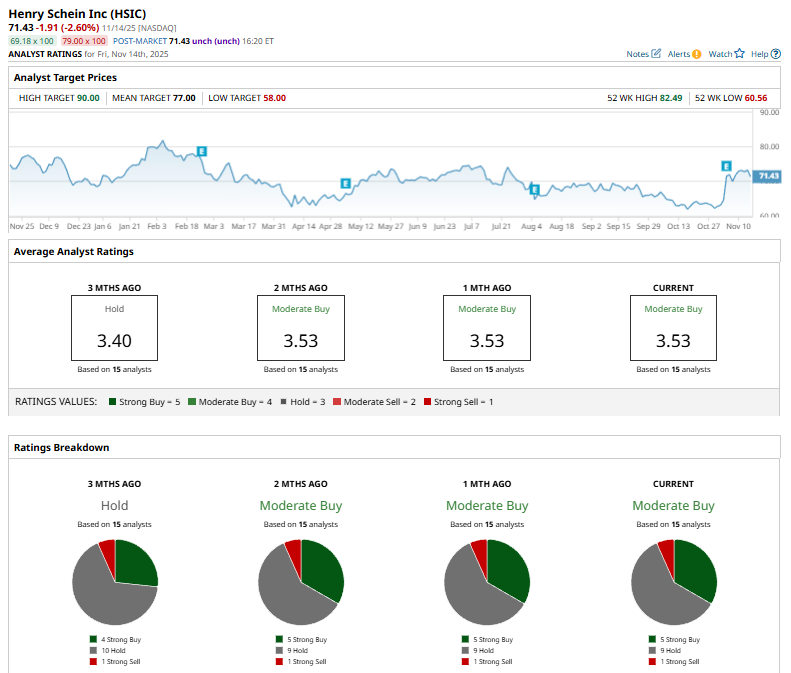
This configuration is bullish than three months ago, with four “Strong Buy” ratings on the stock.

On Oct. 14, Leerink Partners analyst Michael Cherny reaffirmed his “Hold” rating on Henry Schein and maintained a $71 price target.

The mean price target of $77 represents a 7.8% premium to HSIC’s current price levels. The Street-high price target of $90 suggests a 26% potential upside.


On the date of publication, Kritika Sarmah did not have (either directly or indirectly) positions in any of the securities mentioned in this article. All information and data in this article is solely for informational purposes. For more information please view the Barchart Disclosure Policy here.


More news from Barchart

Recent Quotes

View More
Symbol Price Change (%)
AMZN  220.69
+3.55 (1.63%)
AAPL  271.49
+5.24 (1.97%)
AMD  203.78
-2.24 (-1.09%)
BAC  51.56
+0.56 (1.10%)
GOOG  299.65
+9.67 (3.33%)
META  594.25
+5.10 (0.87%)
MSFT  472.12
-6.31 (-1.32%)
NVDA  178.88
-1.76 (-0.97%)
ORCL  198.76
-11.93 (-5.66%)
TSLA  391.09
-4.14 (-1.05%)
Stock Quote API & Stock News API supplied by www.cloudquote.io
Quotes delayed at least 20 minutes.
By accessing this page, you agree to the Privacy Policy and Terms Of Service.


IntelligentValue Home
Close Window

DISCLAIMER

All content herein is issued solely for informational purposes and is not to be construed as an offer to sell or the solicitation of an offer to buy, nor should it be interpreted as a recommendation to buy, hold or sell (short or otherwise) any security.  All opinions, analyses, and information included herein are based on sources believed to be reliable, but no representation or warranty of any kind, expressed or implied, is made including but not limited to any representation or warranty concerning accuracy, completeness, correctness, timeliness or appropriateness. We undertake no obligation to update such opinions, analysis or information. You should independently verify all information contained on this website. Some information is based on analysis of past performance or hypothetical performance results, which have inherent limitations. We make no representation that any particular equity or strategy will or is likely to achieve profits or losses similar to those shown. Shareholders, employees, writers, contractors, and affiliates associated with ETFOptimize.com may have ownership positions in the securities that are mentioned. If you are not sure if ETFs, algorithmic investing, or a particular investment is right for you, you are urged to consult with a Registered Investment Advisor (RIA). Neither this website nor anyone associated with producing its content are Registered Investment Advisors, and no attempt is made herein to substitute for personalized, professional investment advice. Neither ETFOptimize.com, Global Alpha Investments, Inc., nor its employees, service providers, associates, or affiliates are responsible for any investment losses you may incur as a result of using the information provided herein. Remember that past investment returns may not be indicative of future returns.

Copyright © 1998-2017 ETFOptimize.com, a publication of Optimized Investments, Inc. All rights reserved.