Valued at a market cap of $196 billion, Intuitive Surgical, Inc. (ISRG) is a global leader in robotic-assisted surgery and the maker of the da Vinci Surgical System, one of the most widely used robotic platforms in minimally invasive procedures. The California-based company provides surgical robots, instruments, accessories, and training to hospitals and surgeons worldwide.
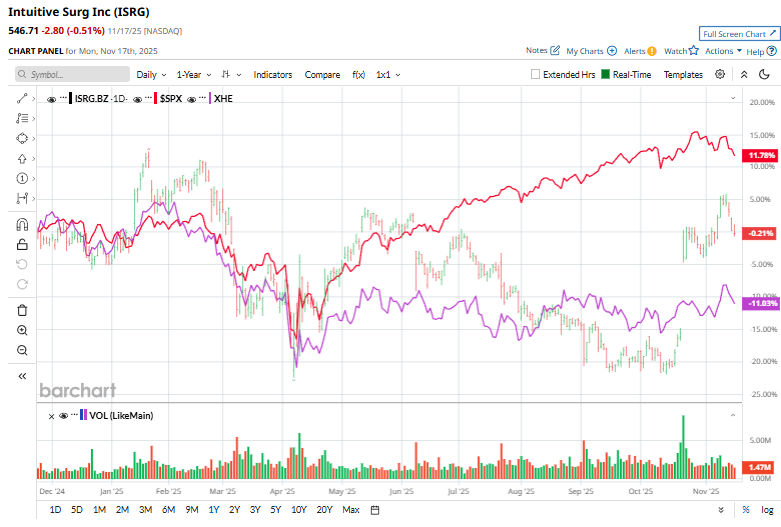
This health tech titan has struggled to keep up with the broader market over the past 52 weeks. Shares of Intuitive Surgical have rallied 3.6% over this time frame, while the broader S&P 500 Index ($SPX) has gained 13.7%. Moreover, on a YTD basis, the stock is up 4.7%, compared to SPX’s 13.4% return.
Zooming in further, ISRG has outpaced the SPDR S&P Health Care Equipment ETF’s (XHE) 8.5% decline over the past 52 weeks and 8.1% downtick on a YTD basis.
On Oct. 21, Intuitive Surgical reported its fiscal Q3 2025 results, and the stock surged 13.9% in the following trading session as the company delivered a standout quarter. Revenue climbed to $2.51 billion, up 23% year over year, supported by strong growth in global procedure volumes and continued adoption of the da Vinci and Ion robotic platforms. Its instruments and accessories revenue increased by 20% annually to $1.52 billion. Adjusted operating income rose sharply to $976 million, compared with $755 million a year earlier, while adjusted EPS came in at $2.40, handily beating analyst expectations of around $1.99. Encouraged by this strength, management raised full-year procedure growth guidance to 17%–17.5%.
For the current fiscal year, ending in December, analysts expect ISRG’s EPS to rise 6.9% year over year to $6.93. The company’s earnings surprise history is promising. It exceeded the consensus estimates in each of the last four quarters.
Among the 29 analysts covering the stock, the consensus rating is a “Moderate Buy,” which is based on 19 “Strong Buy,” two “Moderate Buy,” seven “Hold,” and one “Strong Sell” rating.
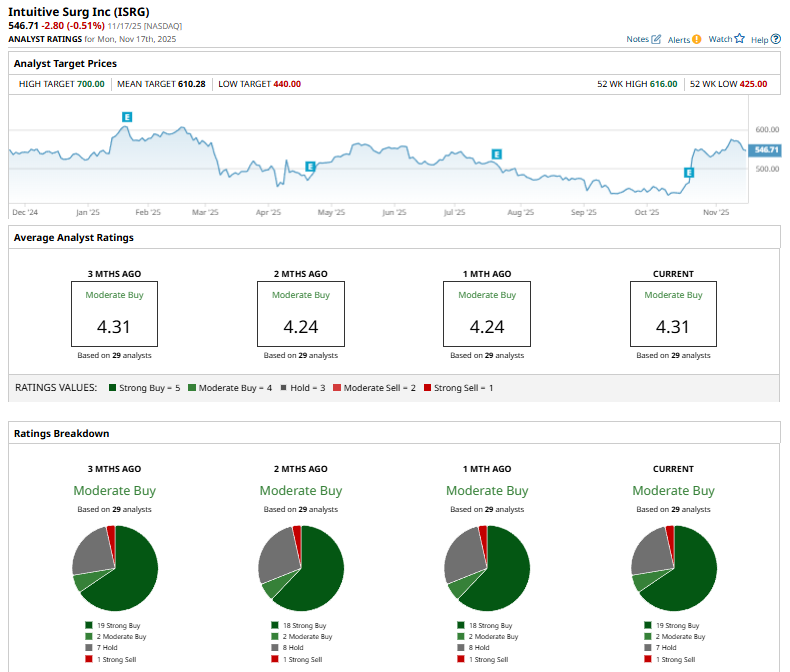
This configuration is bullish than a month ago, with 18 analysts suggesting a “Strong Buy” rating.
On Oct. 8, Evercore ISI analyst Vijay Kumar reiterated a “Hold” rating on Intuitive Surgical and set a $450 price target.
The mean price target of $610.28 represents an 11.6% premium from ISRG’s current price levels, while the Street-high price target of $700 suggests an upside potential of 28%.
On the date of publication, Kritika Sarmah did not have (either directly or indirectly) positions in any of the securities mentioned in this article. All information and data in this article is solely for informational purposes. For more information please view the Barchart Disclosure Policy here.
More news from Barchart
- Warren Buffett Says to Embrace Stock Volatility Because ‘A Tolerance for Short-Term Swings Improves Our Long-Term Prospects’
- Dear Coinbase Stock Fans, Mark Your Calendars for December 17
- Bridgewater Is Betting Big on This 1 Chip Stock (Not Nvidia). Should You Buy Shares Here?
- S&P Futures Slip on Souring Risk Sentiment