In a September 16, 2025, Barchart article on copper prices, I concluded with the following:
Time will tell if copper futures can reach the $5 per pound level again before the end of 2025. Meanwhile, the supply-demand fundamentals continue to support higher prices throughout the rest of this year and in 2026 and beyond.
Don’t Miss a Day: From crude oil to coffee, sign up free for Barchart’s best-in-class commodity analysis.
Nearby COMEX copper futures were at just below $4.70 per pound on September 16, with the three-month LME copper forwards trading $10,126.50 per metric ton. COMEX copper futures and LME forwards were higher in November 2025, with the futures around the $5 per pound level and the forwards above $10,850 per ton.
The bullish trend in copper futures continues after reaching a new record high in July 2025
COMEX copper futures have been in a bullish trend for years.
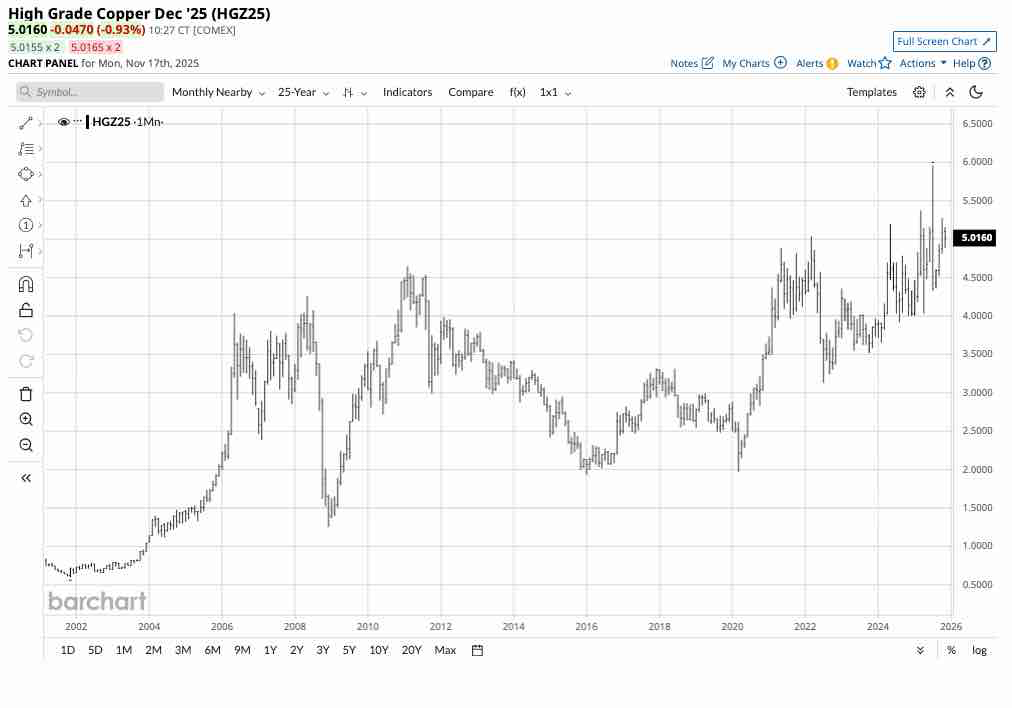
The twenty-five-year monthly continuous COMEX copper futures chart highlights the pattern of higher lows and higher highs since copper futures traded at a November 2001 low of 60.40 cents per pound. Despite the volatile price action in 2025, which took copper futures from a January low of $4.0050 to a July high of $5.9585 per pound, the long-term bullish trend remains intact with copper trading above the $5.00 level on November 17.
LME forwards are trending higher after reaching a new record high in October 2025
While COMEX copper futures reached a record high in July 2025, the three-month London Metals Exchange forwards waited until October to rise to an all-time peak.
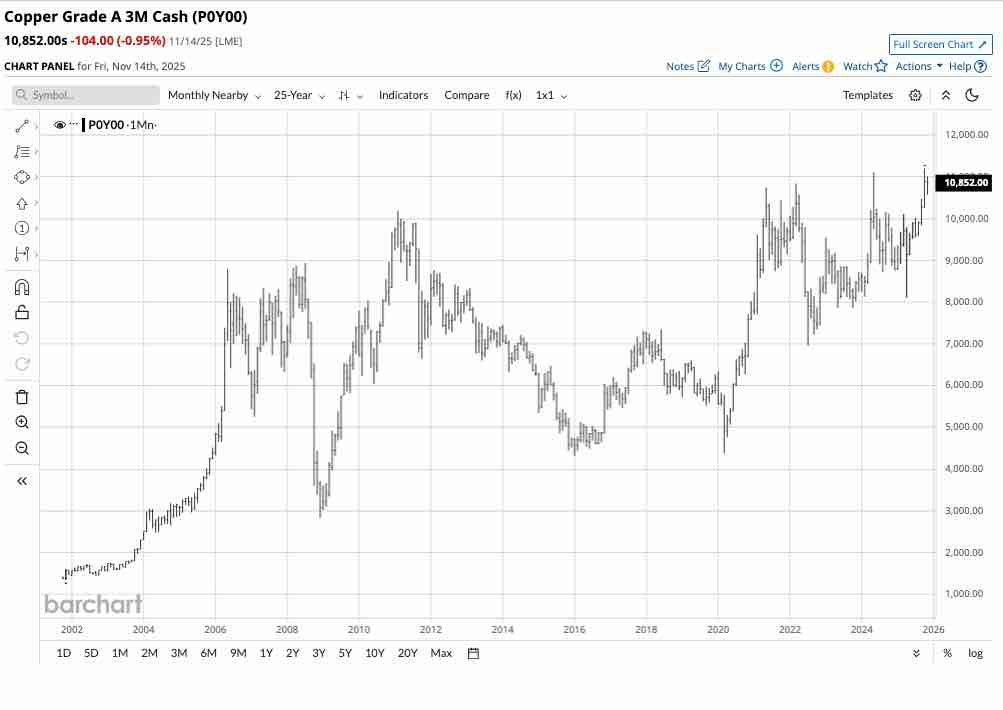
The twenty-five-year LME forward copper chart illustrates the bullish trend that took the red metal from $1,336 in November 2001 to the recent October 2025 record high of $11,200 per metric ton.
LME forwards caught up with the futures- A bullish sign for the red metal
Tariffs had distorted the price differential between the COMEX copper futures, and the LME copper forwards in 2025. The arbitrage or differential widened to a historical high as copper inventories moved from LME to COMEX warehouses. At the end of 2025, LME copper stocks were 271,400 tons, with COMEX inventories at 93,161 tons. As of November 14, the tariffs had caused LME stocks to drop nearly 50% to 135,725 tons, while COMEX copper inventories rose 309.3% to 381,296 metric tons. While the combined stocks rose by over 150,000 tons from the end of 2024 through November 14, LME stocks halved, while COMEX stocks more than quadrupled over the period.
Tariffs and sanctions are trade barriers that distort prices. In the leading copper futures and forward markets, the U.S. administration’s tariffs caused substantial price variance as inventories moved from Europe and other LME warehouses to the U.S. COMEX warehouses.
Meanwhile, the rise to new record highs in COMEX copper prices while LME prices remained below the 2024 peak was a cautionary signal that copper was rising for trade-related rather than fundamental demand reasons. However, the rally in the LME forwards eventually validated copper’s ascent and continued the bullish trend.
A fundamental deficit supports prices- Higher highs on the horizon
In early October 2025, the International Copper Study Group forecasted that the global refined copper market would move into a 150,000 metric ton deficit, with the demand exceeding supply, in 2026. The Group previously expected a 209,000 ton surplus.
Slowing production growth and increasing demand accounted for the shift. Copper demand is rising as it is a critical ingredient in EVs, electronics, and electrical wiring. As AI is driving a significant increase in demand for power generation, the deficit could widen further. Meanwhile, establishing new copper mine supplies takes years, which could further exacerbate the deficit. The bottom line is that slowing production and rising demand support higher copper prices.
CPER is an ETF that moves higher and lower with COMEX copper futures
Technically, the copper bull market that began nearly a quarter of a century ago remains firmly intact. Fundamental analysis continues to support the red metal, and when technical and fundamental factors align, the odds favor a continuation of the current trend. However, even the most aggressive bull markets rarely move in straight lines, and as the copper futures and forward markets have experienced, downside corrections are common. The 2025 tariffs contributed to the price variance, which is likely to persist into 2026. Buying copper on price corrections has been optimal for nearly two and a half decades.
The most direct routes for a risk position in copper are the COMEX futures and LME forwards. Both markets offer put and call option contracts. However, the futures and forwards have a limited addressable market for investors and traders not directly involved in the copper market, as they require margin and specialized accounts.
The U.S. Copper ETF (CPER) holds COMEX copper futures contracts. At $31.08 per share, CPER had over $330.4 million in assets under management. CPER trades an average of over 500,000 shares daily and charges a 1.06% management fee. The most recent rally in December COMEX copper futures took the price 19.8% higher from the July 31 low of $4.4055 to the October 29 high of $5.2790 per pound.
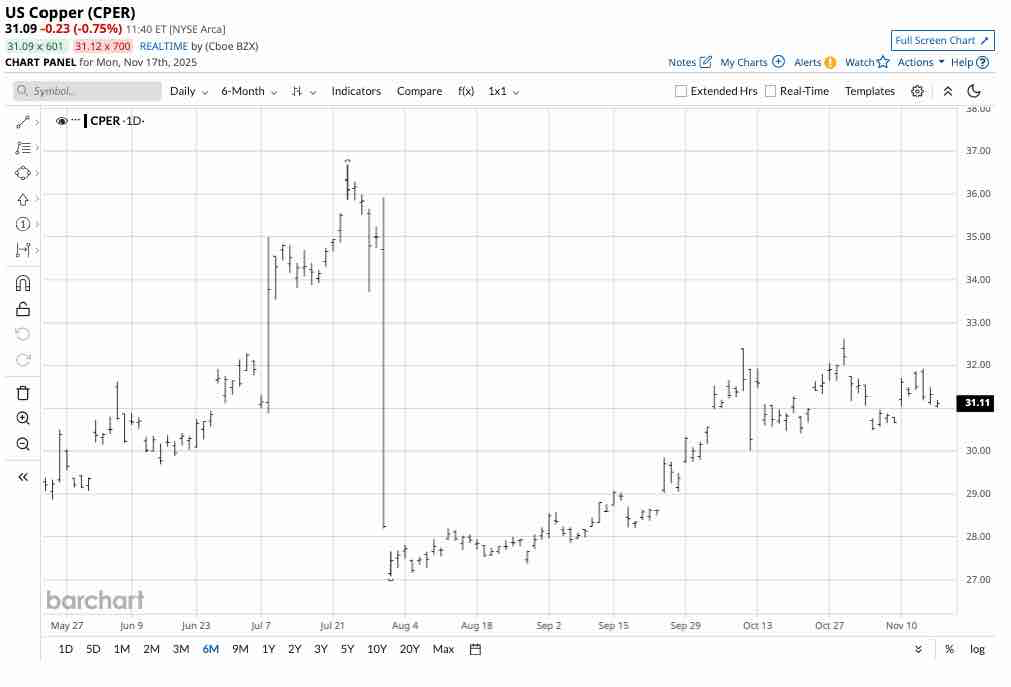
Over the same period, CPER rose 20.5% from $27.08 to $32.62 per share. CPER did an excellent job tracking the nearby COMEX copper futures price during the most recent rally.
I expect copper prices to continue their upward trajectory as technical and fundamental factors support the red nonferrous metal. However, long copper exposure through the CPER ETF during price corrections has been optimal, and that trend is likely to continue. At around the $5 per pound level in November 2025, copper futures could be setting a base for even higher highs in 2026.
On the date of publication, Andrew Hecht did not have (either directly or indirectly) positions in any of the securities mentioned in this article. All information and data in this article is solely for informational purposes. For more information please view the Barchart Disclosure Policy here.
More news from Barchart
- Is Copper Setting a Base for a New High?
- Base Metals in Q3- Where are the Industrial Metals Heading in Q4 and Beyond?
- Gold Prices Just Hit Another All-Time High. Here Are the 2 Top-Rated Gold Stocks to Buy Now.
- 3 Major Catalysts That Should Keep Precious Metals Prices Elevated as Gold Sets a New Record High