Valued at a market cap of $24.4 billion, Veralto Corporation (VLTO) is a technology company that provides water analytics, water treatment, marking and coding, and packaging and color solutions. The Waltham, Massachusetts-based company plays a key role in ensuring clean water, safe products and consistent global standards.
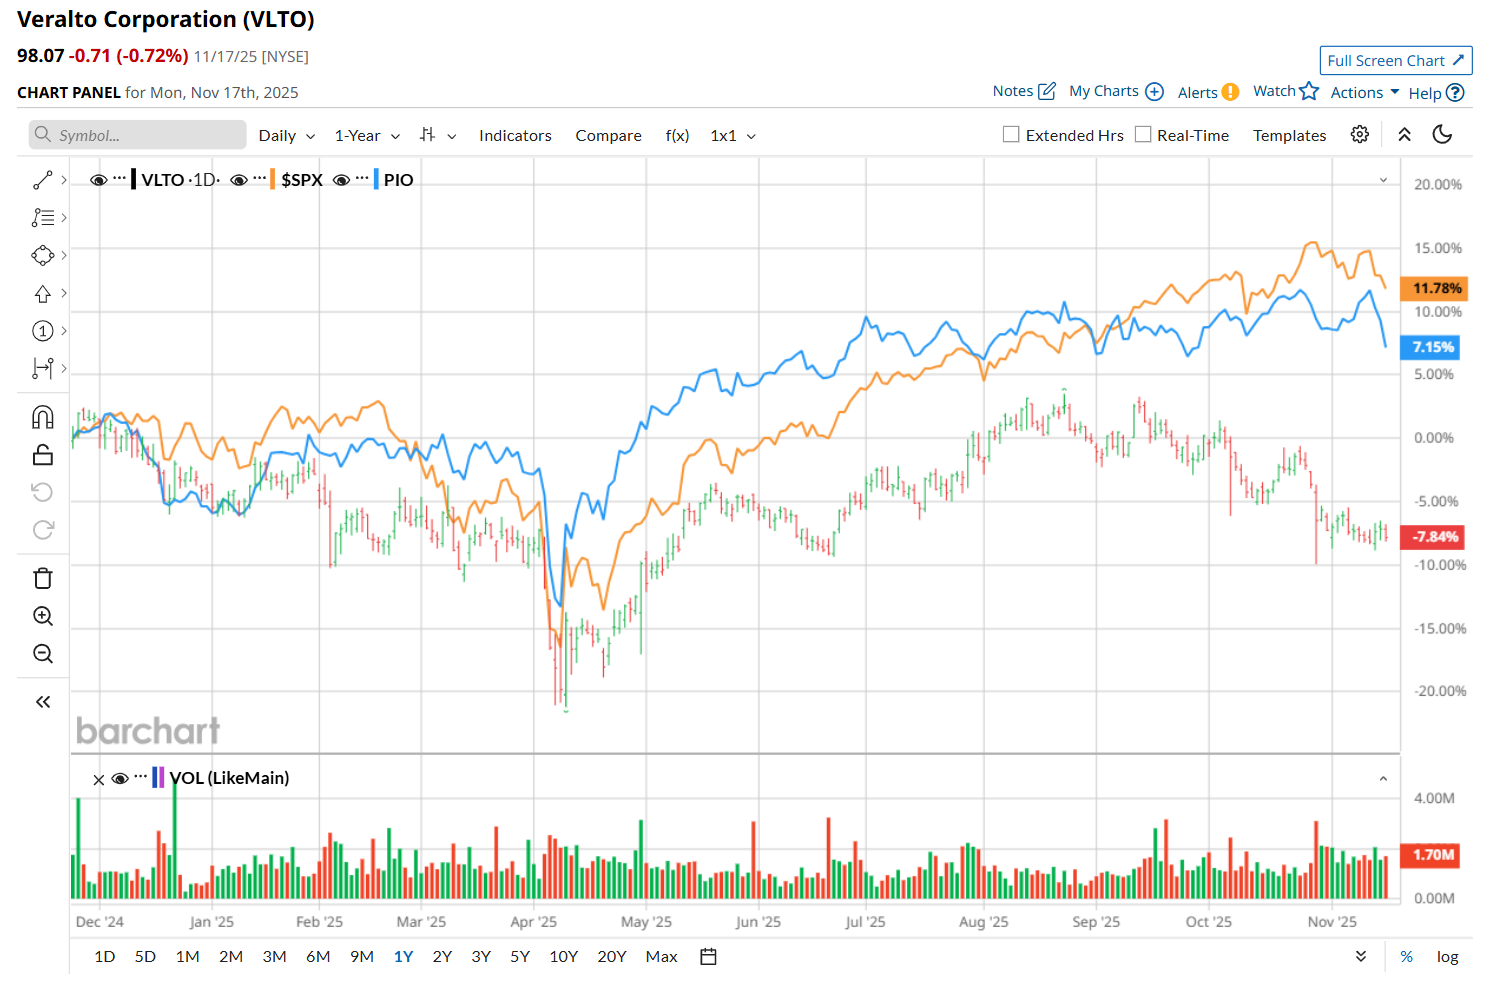
This water treatment company has lagged behind the broader market over the past 52 weeks. Shares of VLTO have declined 4.5% over this time frame, while the broader S&P 500 Index ($SPX) has gained 13.7%. Moreover, on a YTD basis, the stock is down 3.7%, compared to SPX’s 13.4% uptick.
Narrowing the focus, VLTO has also lagged behind the Invesco Global Water ETF’s (PIO) 8.8% rise over the past 52 weeks and 13.2% YTD return.
On Oct. 29, shares of VLTO plunged 3% after delivering its Q3 results. The company’s total revenue surged 6.8% year-over-year to $1.4 billion, meeting analyst estimates. Moreover, its adjusted EPS of $0.99 increased 11.2% from the year-ago quarter, surpassing consensus estimates of $0.95. Strong commercial performance, disciplined operating execution, and rigorous deployment of the Veralto Enterprise System, supported its Q3 results. Additionally, VLTO raised its fiscal 2025 adjusted EPS guidance, now expecting it to range between $3.82 and $3.85.
For the current fiscal year, ending in December, analysts expect VLTO’s EPS to grow 8.5% year over year to $3.84. The company’s earnings surprise history is promising. It exceeded the consensus estimates in each of the last four quarters.
Among the 18 analysts covering the stock, the consensus rating is a "Moderate Buy,” which is based on 10 “Strong Buy” and eight "Hold” ratings.
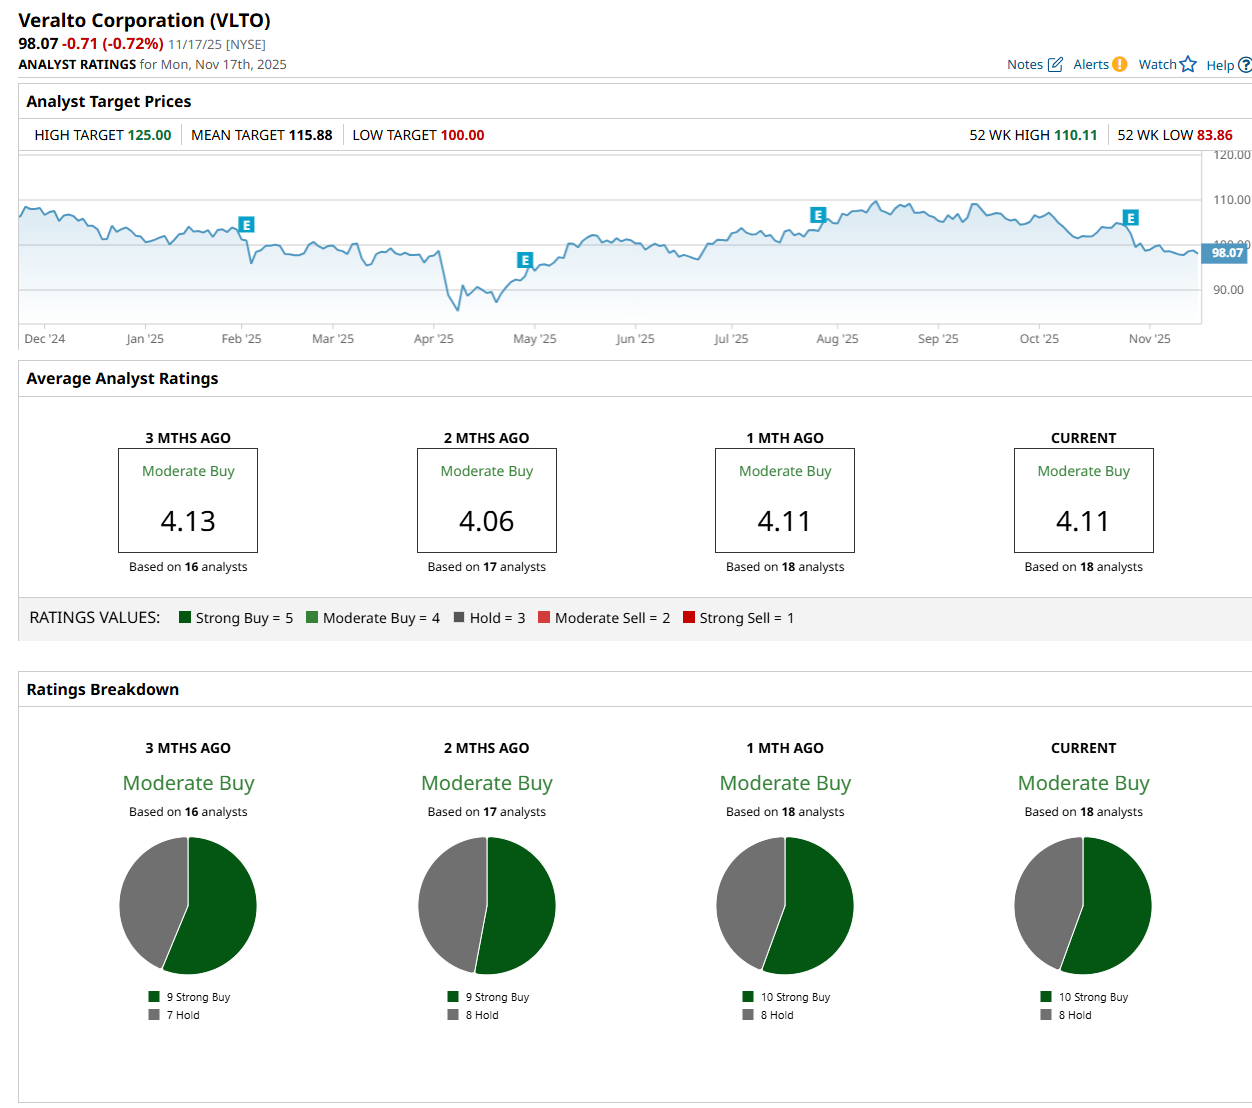
This configuration is slightly more bullish than two months ago, with nine analysts suggesting a “Strong Buy” rating.
On Nov. 5, UBS Group AG (UBS) maintained a "Neutral" rating on VLTO and raised its price target to $112, indicating a 14.2% potential upside from the current levels.
The mean price target of $115.88 represents an 18.2% premium from VLTO’s current price levels, while the Street-high price target of $125 suggests a 27.5% potential upside from the current levels.
On the date of publication, Neharika Jain did not have (either directly or indirectly) positions in any of the securities mentioned in this article. All information and data in this article is solely for informational purposes. For more information please view the Barchart Disclosure Policy here.
More news from Barchart
- Dear Coinbase Stock Fans, Mark Your Calendars for December 17
- Warren Buffett Says to Embrace Stock Volatility Because ‘A Tolerance for Short-Term Swings Improves Our Long-Term Prospects’
- Bridgewater Is Betting Big on This 1 Chip Stock (Not Nvidia). Should You Buy Shares Here?
- S&P Futures Slip on Souring Risk Sentiment