Wynn Resorts, Limited (WYNN) is a world-class developer and operator of luxury casinos and hotel properties, operating major resorts in global hotspots such as Las Vegas, Macau, and near Boston. Renowned for elegant accommodations, expansive gaming, top-tier dining, and lively entertainment, Wynn delivers prime hospitality experiences. The company has its headquarters in Las Vegas, Nevada and has a market capitalization of $12.55 billion.
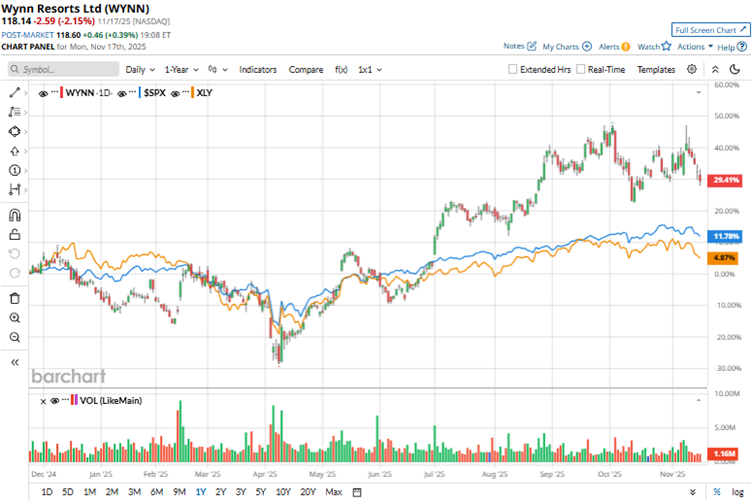
Based on firm performance in its core markets and an expansionary outlook in lucrative markets, such as the UAE, the stock has been performing well on Wall Street. Over the past 52 weeks, Wynn’s stock has gained 30.2%, while it is up 22.1% over the past six months. The stock had reached a 52-week high of $134.23 in October, but is down almost 12% from that level.
The S&P 500 Index ($SPX) has gained 13.7% and 12% over the same periods, respectively, which reflects that the stock is outperforming the broader market. The nature of Wynn Resorts’ business classifies it as a consumer discretionary stock. Comparing it with the Consumer Discretionary Select Sector SPDR Fund (XLY), we see that the ETF has risen 7.2% over the past 52 weeks and 5.1% over the past six months, underperforming Wynn’s stock.
On Nov. 6, Wynn reported its third-quarter results for fiscal 2025. The company’s operating revenues increased 8.3% year-over-year (YOY) to $1.83 billion, surpassing the $1.77 billion that Wall Street analysts had expected. This gain was based on a 15.3% increase in revenues from its casinos, reaching $1.17 billion. On the other hand, Wynn’s adjusted EPS dropped from $0.90 to $0.86 YOY. The figure also missed the Street estimate of $1.09.
Wynn Resorts is expanding its partnership with Marjan LLC through a second joint venture development on Al Marjan Island called the Janu Al Marjan Island. The resort is set to open in late 2028.
For the fiscal year 2025, which ends in December 2025, Wall Street analysts expect Wynn’s EPS to decline 27.7% YOY to $4.35 on a diluted basis. However, EPS is expected to increase 22.3% annually to $5.32 in fiscal 2026. The company has missed consensus EPS estimates in three of the four trailing quarters.
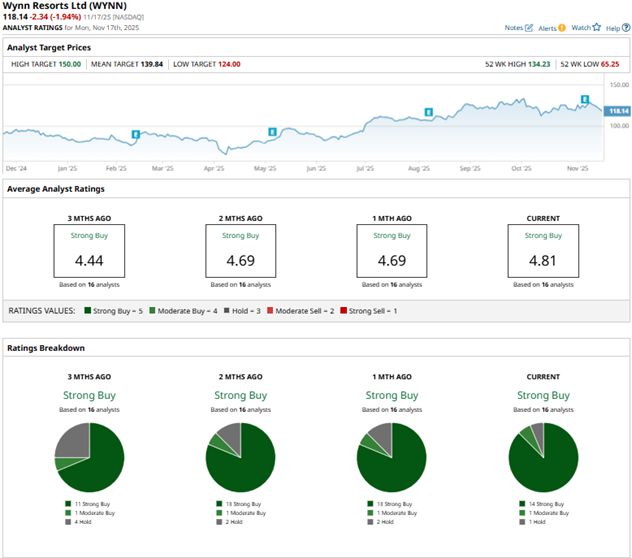
Among the 16 Wall Street analysts covering Wynn Resorts’ stock, the consensus is a “Strong Buy.” That’s based on 14 “Strong Buy” ratings, one “Moderate Buy,” and one “Hold.” The ratings configuration is more bullish than it was a month ago, with 14 “Strong Buy” ratings now, up from 13 previously.
Recently, analysts at Mizuho raised the price target on Wynn’s stock from $126 to $131, while maintaining the rating at “Outperform.” This price target raise was based on the company’s better-than-expected results in Las Vegas, despite a broader market weakness in the region.
Wynn’s mean price target of $139.84 indicates an 18.4% upside over current market prices. The Street-high price target of $150 implies a potential upside of 27%.
On the date of publication, Anushka Mukherjee did not have (either directly or indirectly) positions in any of the securities mentioned in this article. All information and data in this article is solely for informational purposes. For more information please view the Barchart Disclosure Policy here.
More news from Barchart
- Down 30% in a Month, Should You Buy MicroStrategy Stock Here?
- Here Is What Options Traders Expect for NVDA Stock After Nvidia Reports Q3 Results This Week
- ‘Good News’ Is Coming for Nvidia Stock, So Buy NVDA Shares Here
- This ‘Buy’-Rated Stock Is Calling for 34% Revenue Growth and Analysts Think Shares Can Gain 48% from Here