Valued at a market cap of $15.4 billion, J.B. Hunt Transport Services, Inc. (JBHT) is a transportation and logistics company based in Lowell, Arkansas. It is known for its extensive intermodal, dedicated contract services, and integrated supply chain solutions.
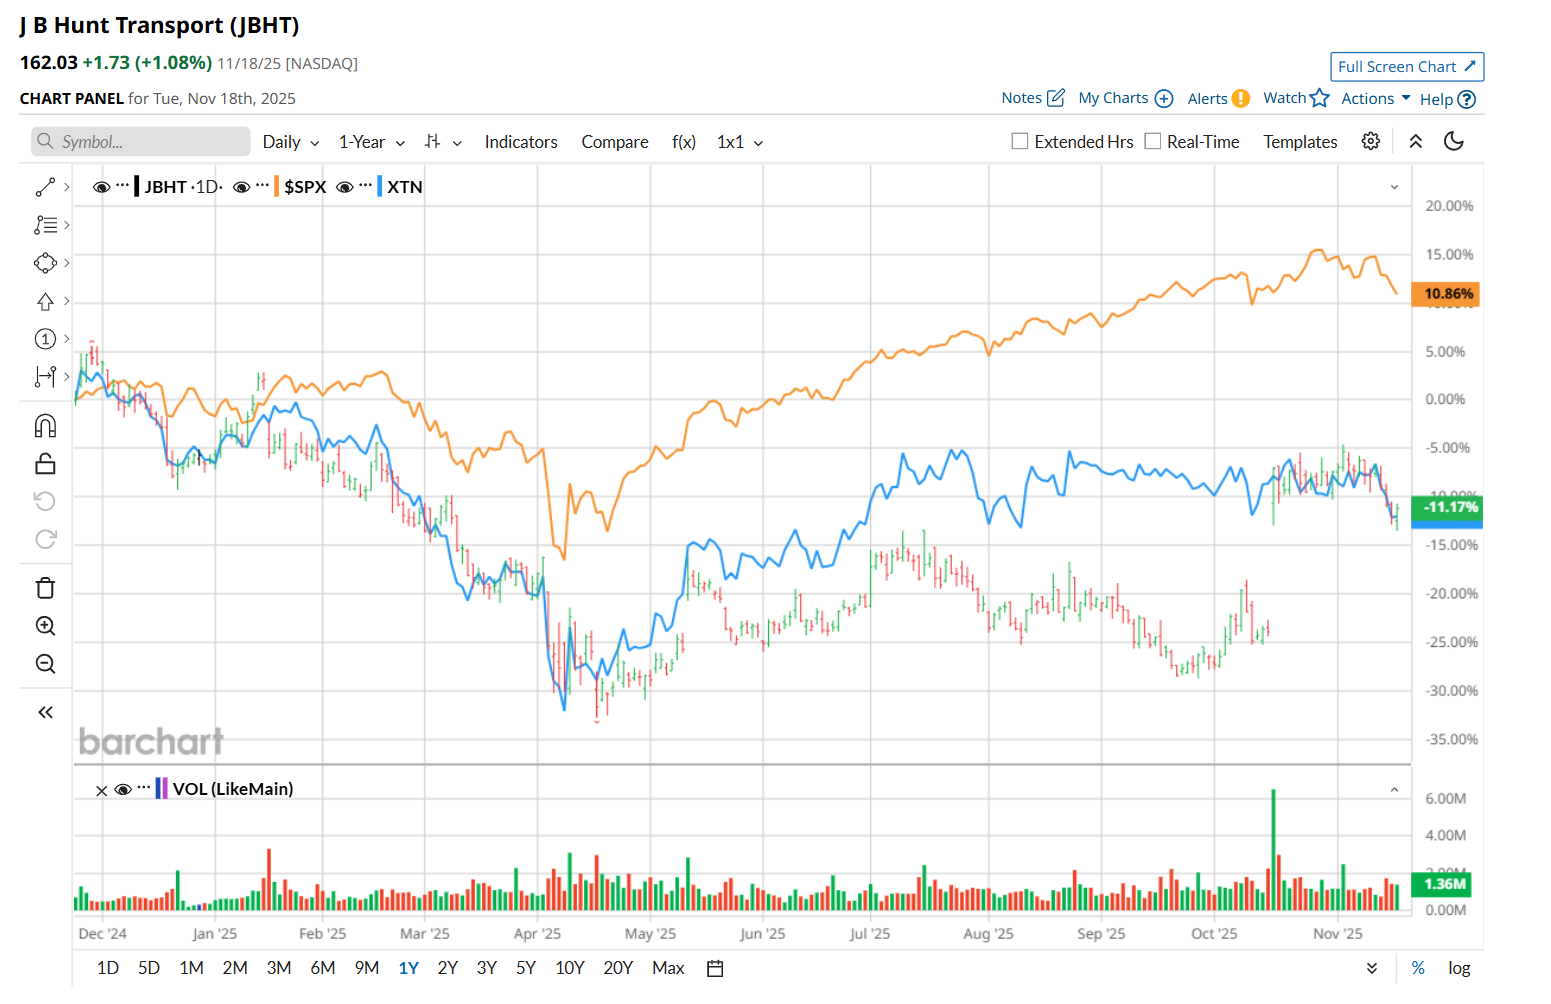
This freight and logistics company has considerably underperformed the broader market over the past 52 weeks. Shares of JBHT have declined 11.9% over this time frame, while the broader S&P 500 Index ($SPX) has gained 12.3%. Moreover, on a YTD basis, the stock is down 5.1%, compared to SPX’s 12.5% uptick.
Narrowing the focus, JBHT has also lagged behind the SPDR S&P Transportation ETF’s (XTN) 10.3% drop over the past 52 weeks. However, it has outperformed XTN’s 6.2% YTD loss.
On Oct. 15, JBHT released stronger-than-expected Q3 earnings results, and its shares surged 22.1% in the following trading session. The company’s EPS of $1.76 improved 18.1% year-over-year, handily surpassing consensus estimates of $1.47. Meanwhile, its revenue of $3.1 billion declined marginally from the year-ago quarter, but topped analyst expectations by nearly 1%. Despite the fall in revenue, its bottom line increased due to structural cost removal, improved productivity across the organization, and lower purchase transportation costs.
For the current fiscal year, ending in December, analysts expect JBHT’s EPS to grow 7.9% year over year to $6. The company’s earnings surprise history is mixed. It topped the consensus estimates in two of the last four quarters, while missing on two other occasions.
Among the 25 analysts covering the stock, the consensus rating is a "Moderate Buy,” which is based on 11 “Strong Buy,” one "Moderate Buy,” 12 "Hold,” and one "Moderate Sell” rating.
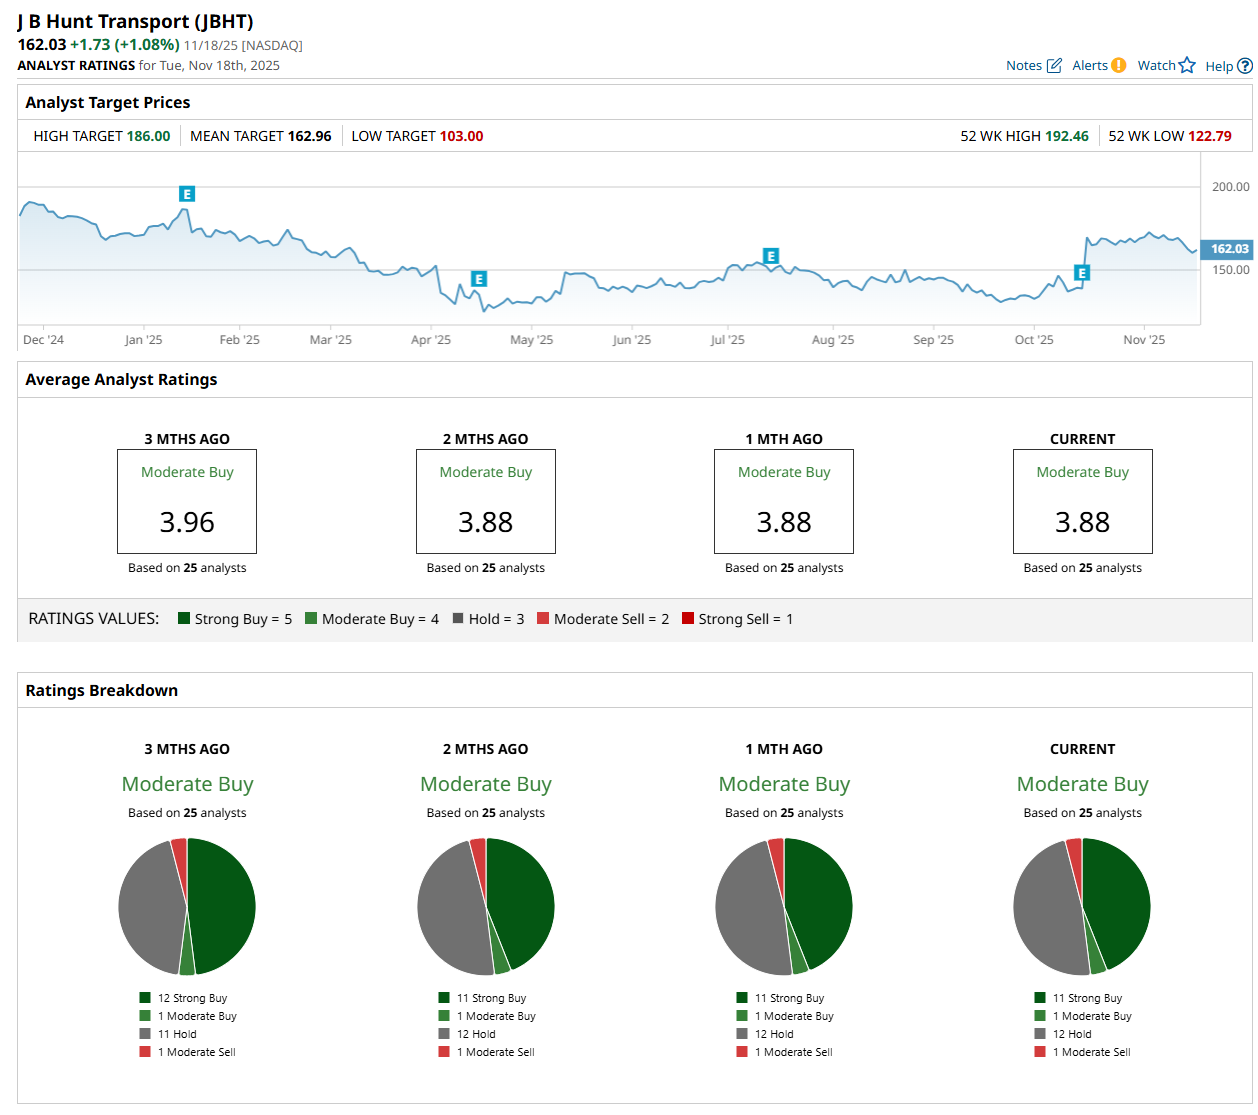
This configuration is slightly less bullish than three months ago, with 12 analysts suggesting a “Strong Buy” rating.
On Nov. 10, Ariel Rosa from Citigroup Inc. (C) maintained a "Buy" rating on JBHT, with a price target of $175, indicating an 8% potential upside from the current levels.
The mean price target of $162.96 represents a marginal premium from JBHT’s current price levels, while the Street-high price target of $186 suggests a 14.8% potential upside from the current levels.
On the date of publication, Neharika Jain did not have (either directly or indirectly) positions in any of the securities mentioned in this article. All information and data in this article is solely for informational purposes. For more information please view the Barchart Disclosure Policy here.
More news from Barchart
- As Super Micro Reveals a New AI Factory, Should You Buy, Sell, or Hold SMCI Stock?
- This Blue-Chip Stock Is a Heavy Weight in Weight-Loss Drugs
- Where Will Amazon Stock Trade in One Year — And What Will Drive AMZN?
- Elon Musk Just Teased Tesla’s ‘Most Memorable Product Unveil Ever’ with Roadster in Development and New ‘Electric Flying Car’


