BXP, Inc. (BXP), formerly known as Boston Properties, Inc., is a prominent real estate investment trust (REIT) that owns, develops, and manages top-tier office properties across key U.S. cities. The company has its headquarters in Boston, Massachusetts.
Reflecting its expansion beyond Boston, the company officially changed its name to BXP, Inc. in July 2024. It holds a significant presence in major markets such as Boston, New York, San Francisco, Los Angeles, Seattle, and Washington, D.C. BXP has a market capitalization of $10.95 billion.
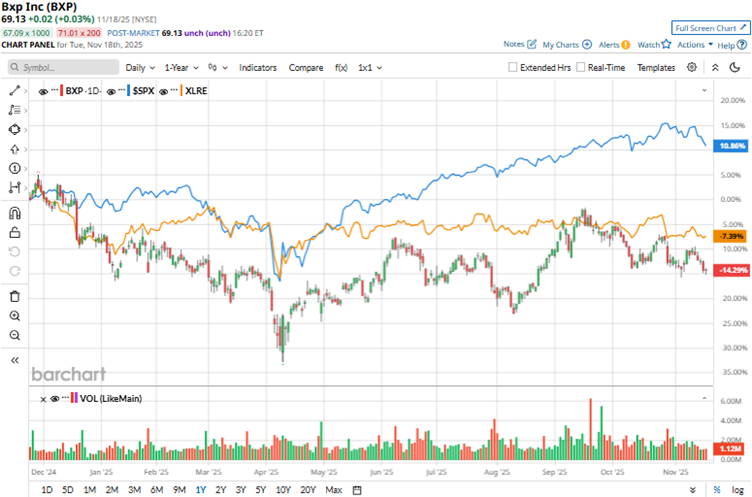
With macroeconomic uncertainties affecting real estate, the stock has dropped 11.8% over the past 52 weeks and gained only 1.9% over the past six months. The stock had reached a 52-week low of $54.22 in April, but is up 27.5% from that level.
On the other hand, the broader S&P 500 Index ($SPX) has gained 12.3% and 11.1% over the same periods, respectively, indicating that the stock has underperformed the broader market. However, the Real Estate Select Sector SPDR Fund (XLRE) has declined 5.8% over the past 52 weeks and 2.8% over the past six months, indicating that the stock has underperformed its sector over the past year but has outperformed over the past six months.
On Oct. 28, BXP reported its third-quarter results for fiscal 2025. The REIT’s quarterly revenue increased 1.4% year-over-year (YOY) to $871.51 million, surpassing the $807.9 million that was expected by Wall Street analysts. Funds from operations (FFO) is a closely watched metric for REITs. BXP’s FFO per share for the quarter was $1.74. Although this figure was lower than the $1.81 reported a year earlier, it was higher than the $1.72 that analysts had expected.
BXP also reported seeing strong leasing momentum in the third quarter. During the quarter, the company signed more than 1.5 million square feet of leases, with a weighted-average lease term of 7.9 years, underscoring a 38% YOY increase.
For the fiscal year 2025, which ends in December 2025, Wall Street analysts expect BXP’s profit to decline 2.8% YOY to $6.90 per share . However, the bottom line is expected to increase 2.2% annually to $7.05 per share in fiscal 2026. The company has a mixed history of surpassing consensus estimates: it topped them in two of the four trailing quarters, matched them in one, and missed them in one.
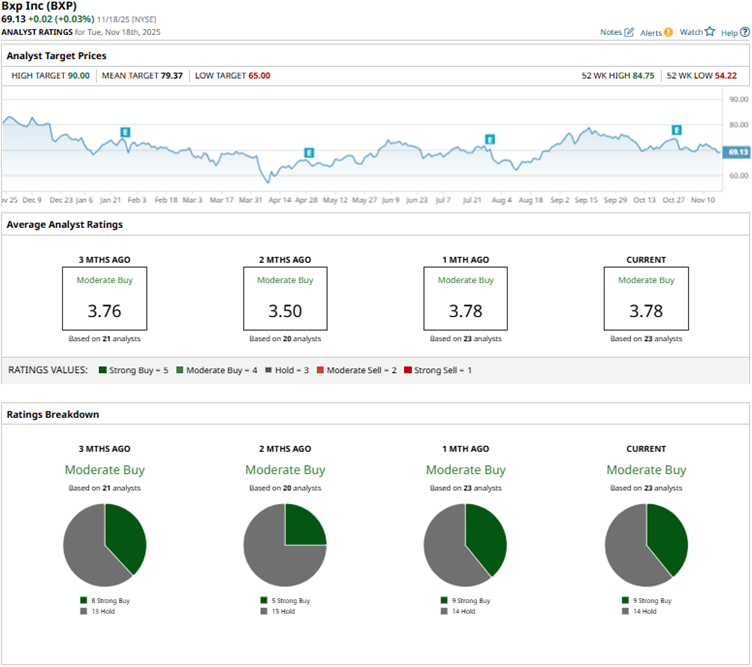
Among the 23 Wall Street analysts covering BXP’s stock, the consensus is a “Moderate Buy.” That’s based on nine “Strong Buy” ratings and 14 “Holds.” The ratings configuration is more bullish than it was two months ago, with nine “Strong Buy” ratings now, up from five previously.
Recently, analysts at Evercore ISI lowered BXP’s price target from $77 to $76, while maintaining an “In Line” rating on its shares. While Q4 is expected to continue seeing strong leasing activity, the overall outlook for office REITs remains cautious.
BXP’s mean price target of $79.37 indicates a 14.8% upside over current market prices. The Street-high price target of $90 implies a potential upside of 30.2%.
On the date of publication, Anushka Mukherjee did not have (either directly or indirectly) positions in any of the securities mentioned in this article. All information and data in this article is solely for informational purposes. For more information please view the Barchart Disclosure Policy here.
More news from Barchart
- This Blue-Chip Stock Is a Heavy Weight in Weight-Loss Drugs
- Where Will Amazon Stock Trade in One Year — And What Will Drive AMZN?
- Elon Musk Just Teased Tesla’s ‘Most Memorable Product Unveil Ever’ with Roadster in Development and New ‘Electric Flying Car’
- Netflix Stock Is Now More Accessible After a 10-for-1 Split, But Is NFLX a Buy?


