Sunnyvale, California-based Synopsys, Inc. (SNPS) provides electronic design automation (EDA) software products for the design and testing of integrated circuits. With a market cap of $72.5 billion, the company provides design technologies to creators of advanced integrated circuits, electronic systems, and systems-on-a-chip.
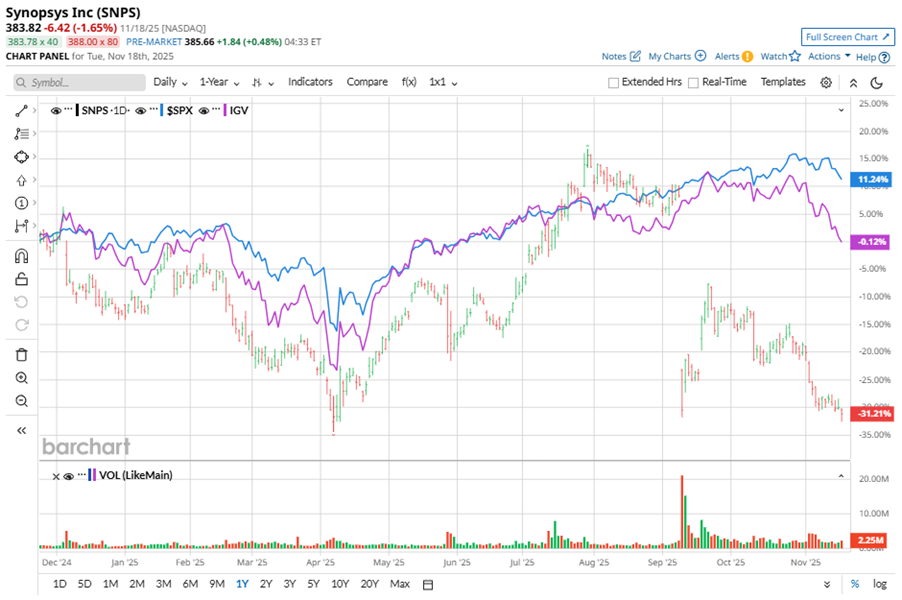
Shares of this global leader in EDA have notably underperformed the broader market over the past year. SNPS has declined 26.8% over this time frame, while the broader S&P 500 Index ($SPX) has rallied nearly 12.3%. In 2025, SNPS’ stock fell 20.9%, compared to the SPX’s 12.5% rise on a YTD basis.
Narrowing the focus, SNPS has also lagged behind the iShares Expanded Tech-Software Sector ETF (IGV). The exchange-traded fund has gained about 3.3% over the past year. Moreover, the ETF’s 4.3% gains on a YTD basis outshine the stock’s double-digit losses over the same time frame.
Synopsys' stock has underperformed amid securities class-action lawsuits alleging that the company misled investors about customer risks and growth prospects, particularly in its Design IP business. This has led to increased volatility and downward pressure on the stock price.
On Sep. 9, SNPS reported its Q3 results, and its shares plummeted 35.8% in the following trading session. Its adjusted EPS of $3.39 missed Wall Street expectations of $3.84. The company’s revenue was $1.7 billion, missing Wall Street's $1.8 billion forecast. SNPS expects full-year adjusted EPS in the range of $12.76 to $12.80, and revenue between $7 billion and $7.1 billion.
For the current fiscal year, ended in October, analysts expect SNPS’ EPS to decline 22.2% to $7.98 on a diluted basis. The company’s earnings surprise history is mixed. It beat the consensus estimate in three of the last four quarters while missing the forecast on another occasion.
Among the 20 analysts covering SNPS stock, the consensus is a “Moderate Buy.” That’s based on 13 “Strong Buy” ratings, one “Moderate Buy,” four “Holds,” one “Moderate Sell,” and one “Strong Sell.”
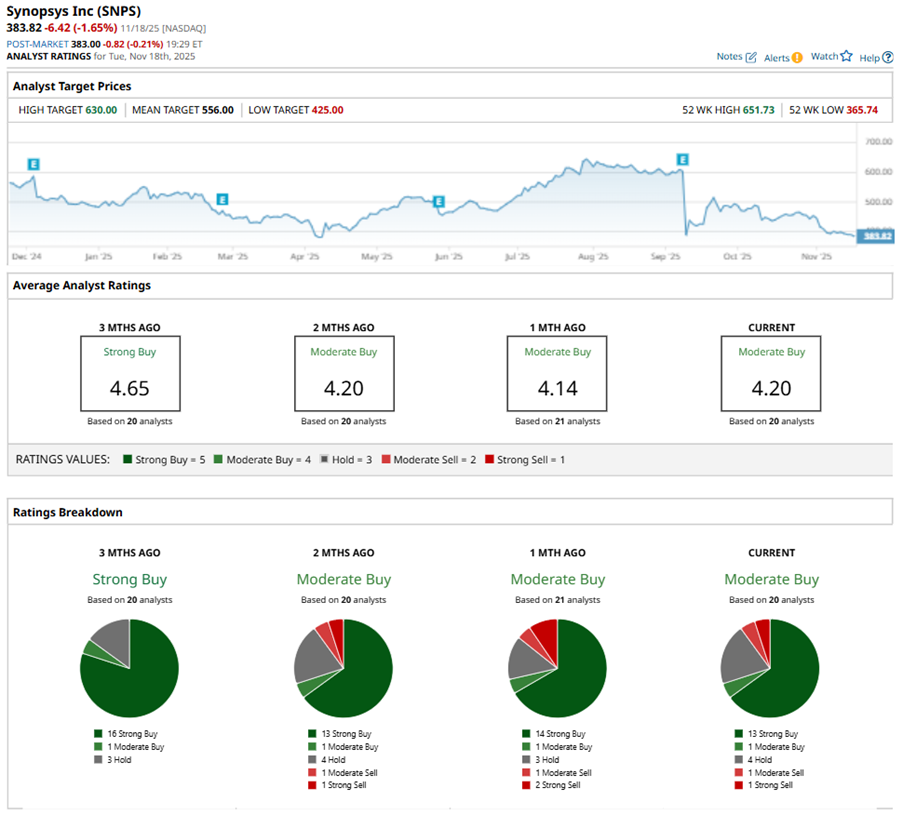
This configuration is less bullish than a month ago, with 14 analysts suggesting a “Strong Buy,” and two analysts advising a “Strong Sell.”
On Nov. 13, Mizuho Financial Group, Inc. (MFG) analyst Siti Panigrahi reiterated a “Buy” rating on SNPS and set a price target of $600, implying a potential upside of 56.3% from current levels.
The mean price target of $556 represents a 44.9% premium to SNPS’ current price levels. The Street-high price target of $630 suggests an ambitious upside potential of 64.1%.
On the date of publication, Neha Panjwani did not have (either directly or indirectly) positions in any of the securities mentioned in this article. All information and data in this article is solely for informational purposes. For more information please view the Barchart Disclosure Policy here.
More news from Barchart