ETFOptimize | High-performance ETF-based Investment Strategies

Quantitative strategies, Wall Street-caliber research, and insightful market analysis since 1998.


ETFOptimize | HOME
Close Window

Is Wall Street Bullish or Bearish on Charter Communications Stock?

Charter Communications, Inc. (CHTR) operates as a broadband connectivity and cable operator company serving residential and commercial customers. Valued at $26.1 billion by market cap, the company offers cable broadcasting, internet, voice, and mass media services.

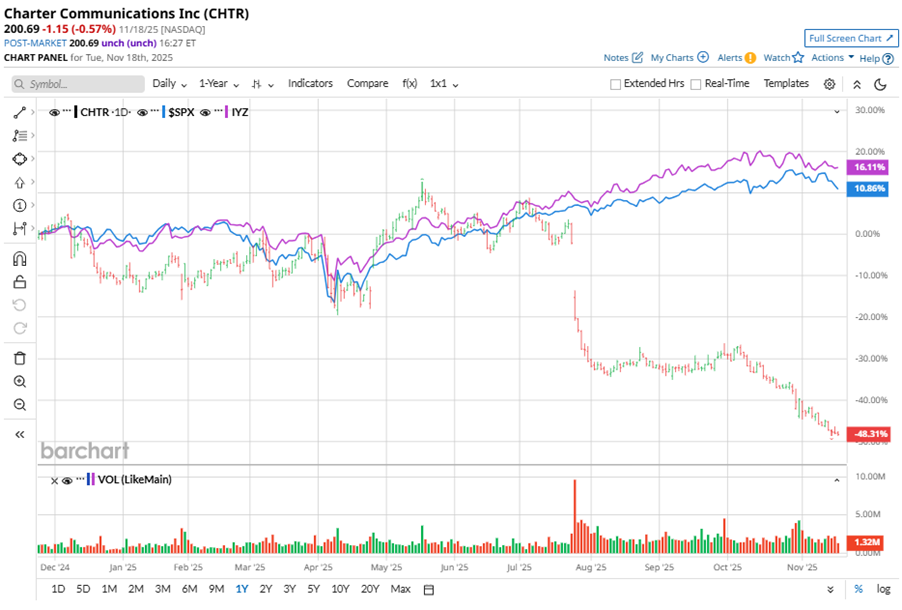
Shares of this broadband giant have considerably underperformed the broader market over the past year. CHTR has declined 47.9% over this time frame, while the broader S&P 500 Index ($SPX) has rallied nearly 12.3%. In 2025, CHTR’s stock fell 41.5%, compared to the SPX’s 12.5% rise on a YTD basis. 


Narrowing the focus, CHTR’s underperformance looks more pronounced compared to the iShares U.S. Telecommunications ETF (IYZ). The exchange-traded fund has gained about 19.3% over the past year. Moreover, the ETF’s 19.6% returns on a YTD basis outshine the stock’s losses over the same time frame.

www.barchart.com

CHTR's underperformance was driven by a larger-than-expected loss of 109,000 internet customers, attributed to intense competition from fixed wireless and fiber providers. Despite adding 500,000 mobile lines and improving video customer retention, the company faced challenges in new customer acquisitions and a demanding advertising environment. 

On Oct. 31, CHTR reported its Q3 results, and its shares closed down by 5% in the following trading session. Its EPS of $8.34 fell short of Wall Street expectations of $9.32. The company’s revenue was $13.67 billion, missing Wall Street forecasts of $13.74 billion.

For the current fiscal year, ending in December, analysts expect CHTR’s EPS to grow 5% to $36.73 on a diluted basis. The company’s earnings surprise history is disappointing. It missed the consensus estimates in three of the last three quarters while beating the forecast on another occasion. 

Among the 25 analysts covering CHTR stock, the consensus is a “Hold.” That’s based on nine “Strong Buy” ratings, 12 “Holds,” and four “Strong Sells.”

www.barchart.com

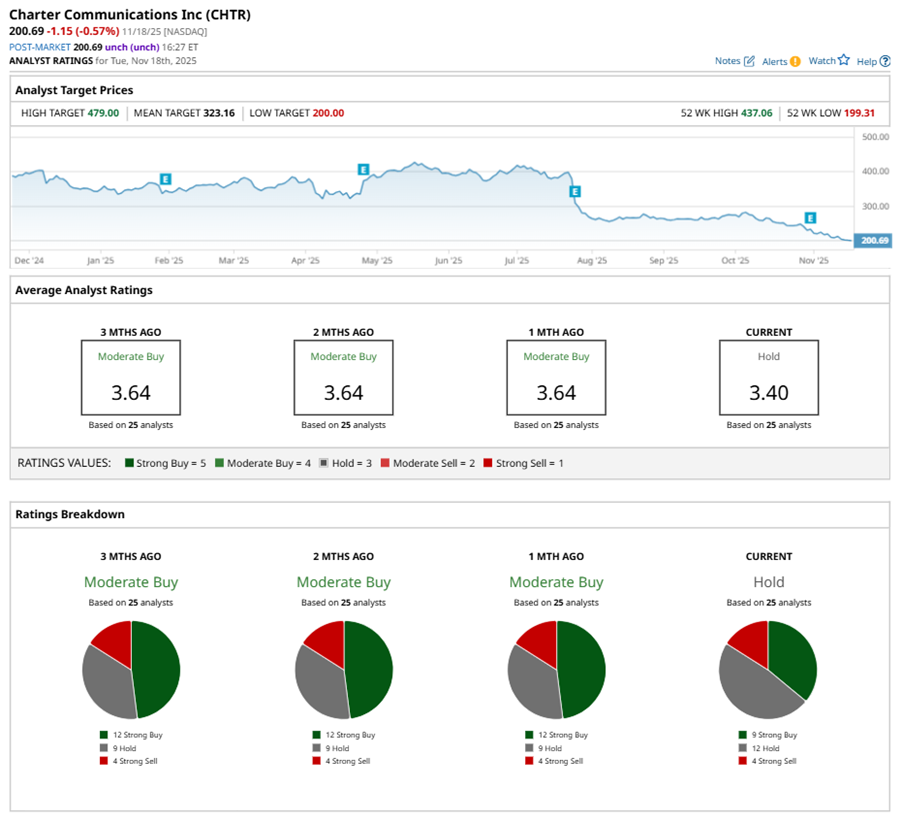
This configuration is less bullish than a month ago, with an overall rating of “Moderate Buy,” consisting of 12 analysts suggesting a “Strong Buy.”

On Nov. 3, RBC Capital analyst Jonathan Atkin maintained a “Sector Perform” rating on CHTR and lowered the price target to $265, implying a potential upside of 32% from current levels.

The mean price target of $323.16 represents a 61% premium to CHTR’s current price levels. The Street-high price target of $479 suggests an ambitious upside potential of 138.7%. 


On the date of publication, Neha Panjwani did not have (either directly or indirectly) positions in any of the securities mentioned in this article. All information and data in this article is solely for informational purposes. For more information please view the Barchart Disclosure Policy here.


More news from Barchart

Recent Quotes

View More
Symbol Price Change (%)
AMZN  222.69
+0.00 (0.00%)
AAPL  268.56
+0.00 (0.00%)
AMD  223.55
+0.00 (0.00%)
BAC  52.02
+0.00 (0.00%)
GOOG  292.99
+0.00 (0.00%)
META  590.32
+0.00 (0.00%)
MSFT  487.05
-0.07 (-0.01%)
NVDA  186.52
+0.00 (0.00%)
ORCL  225.53
+0.00 (0.00%)
TSLA  403.99
+0.00 (0.00%)
Stock Quote API & Stock News API supplied by www.cloudquote.io
Quotes delayed at least 20 minutes.
By accessing this page, you agree to the Privacy Policy and Terms Of Service.


IntelligentValue Home
Close Window

DISCLAIMER

All content herein is issued solely for informational purposes and is not to be construed as an offer to sell or the solicitation of an offer to buy, nor should it be interpreted as a recommendation to buy, hold or sell (short or otherwise) any security.  All opinions, analyses, and information included herein are based on sources believed to be reliable, but no representation or warranty of any kind, expressed or implied, is made including but not limited to any representation or warranty concerning accuracy, completeness, correctness, timeliness or appropriateness. We undertake no obligation to update such opinions, analysis or information. You should independently verify all information contained on this website. Some information is based on analysis of past performance or hypothetical performance results, which have inherent limitations. We make no representation that any particular equity or strategy will or is likely to achieve profits or losses similar to those shown. Shareholders, employees, writers, contractors, and affiliates associated with ETFOptimize.com may have ownership positions in the securities that are mentioned. If you are not sure if ETFs, algorithmic investing, or a particular investment is right for you, you are urged to consult with a Registered Investment Advisor (RIA). Neither this website nor anyone associated with producing its content are Registered Investment Advisors, and no attempt is made herein to substitute for personalized, professional investment advice. Neither ETFOptimize.com, Global Alpha Investments, Inc., nor its employees, service providers, associates, or affiliates are responsible for any investment losses you may incur as a result of using the information provided herein. Remember that past investment returns may not be indicative of future returns.

Copyright © 1998-2017 ETFOptimize.com, a publication of Optimized Investments, Inc. All rights reserved.