ETFOptimize | High-performance ETF-based Investment Strategies

Quantitative strategies, Wall Street-caliber research, and insightful market analysis since 1998.


ETFOptimize | HOME
Close Window

Is Wall Street Bullish or Bearish on Equinix Stock?

Redwood City, California-based Equinix, Inc. (EQIX) is a data center real estate investment trust (REIT) that provides highly interconnected colocation and digital infrastructure solutions to enterprises, cloud providers, and network operators. Valued at a market cap of $76.5 billion, the company operates a global platform of carrier-neutral facilities that support reliable, secure, and scalable data exchange across markets. 

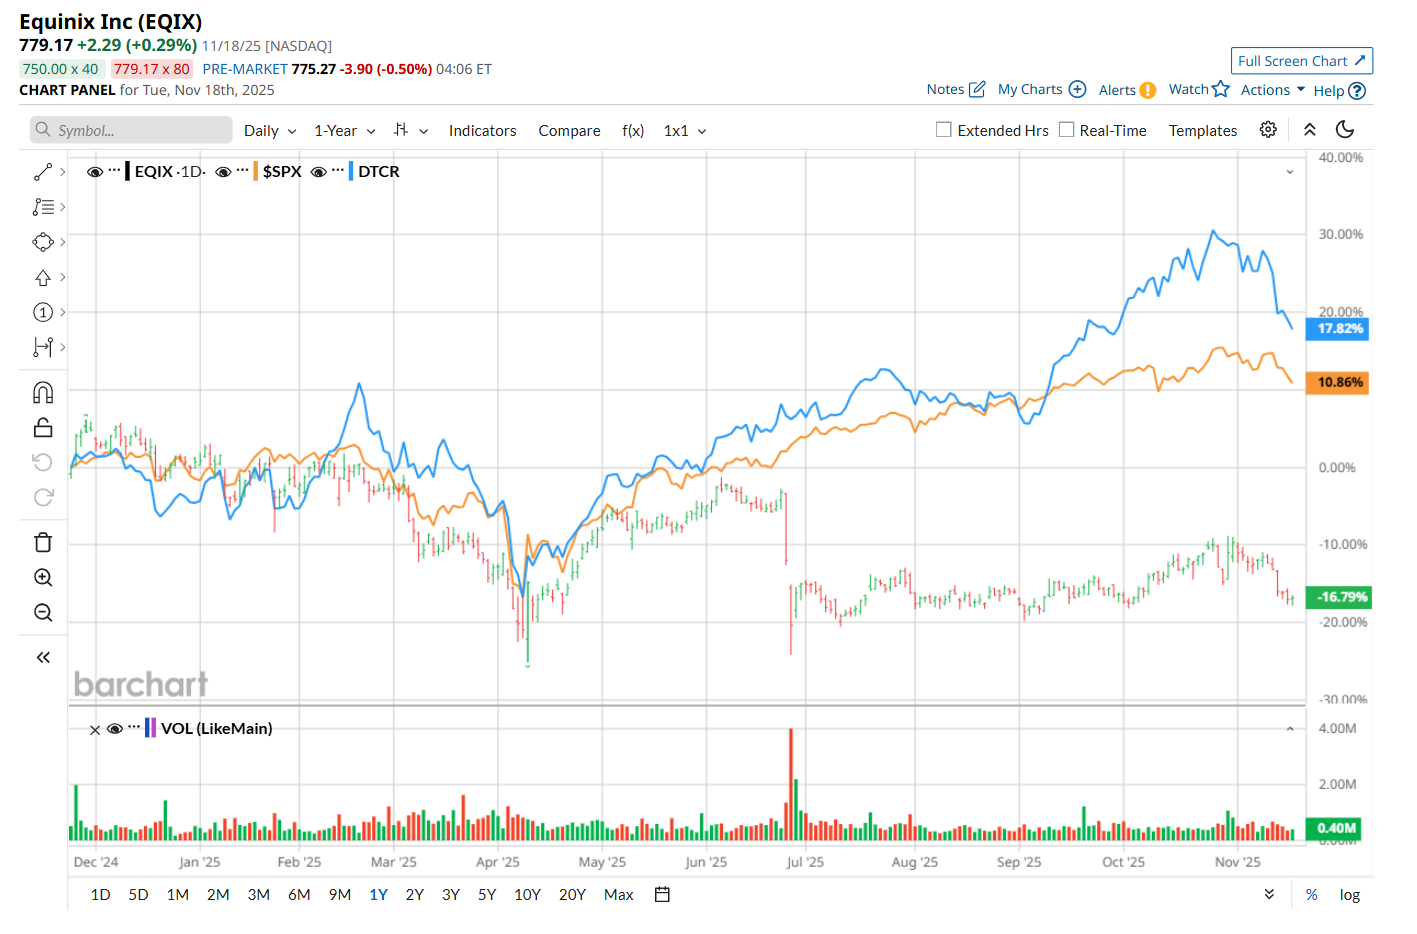
Shares of this specialty REIT have considerably lagged behind the broader market over the past 52 weeks. EQIX has declined 14.3% over this time frame, while the broader S&P 500 Index ($SPX) has gained 12.3%. Moreover, on a YTD basis, the stock is down 17.4%, compared to SPX’s 12.5% uptick.


Narrowing the focus, EQIX’s underperformance looks even more pronounced when compared to the Global X Data Center & Digital Infrastructure ETF’s (DTCR19.2% uptick over the past 52 weeks and 23.4% YTD rise

www.barchart.com

Equinix released its Q3 results on Oct. 29, and its shares climbed 4.4% in the following trading session. Due to robust growth in recurring revenues, the company’s total revenue improved 5.2% year-over-year to $2.3 billion, meeting consensus estimates. Moreover, its AFFO per share of $9.83 increased by a notable 8.6% from the year-ago quarter, surpassing consensus estimates by 6.2%. Additionally, EQIX raised its fiscal 2025 adjusted EBITDA and AFFO per share guidance, further bolstering investor confidence. It now expects adjusted EBITDA in the range of $4.5 billion to $4.6 billion, and projects AFFO per share to be between $37.95 and $38.77. 

For the current fiscal year, ending in December, analysts expect EQIX’s FFO per share to decline 2.9% year over year to $34.01. The company’s FFO surprise history is promising. It topped the consensus estimates in each of the last four quarters. 

Among the 30 analysts covering the stock, the consensus rating is a "Strong Buy,” which is based on 21 “Strong Buy,” three "Moderate Buy,” and six "Hold” ratings.

www.barchart.com

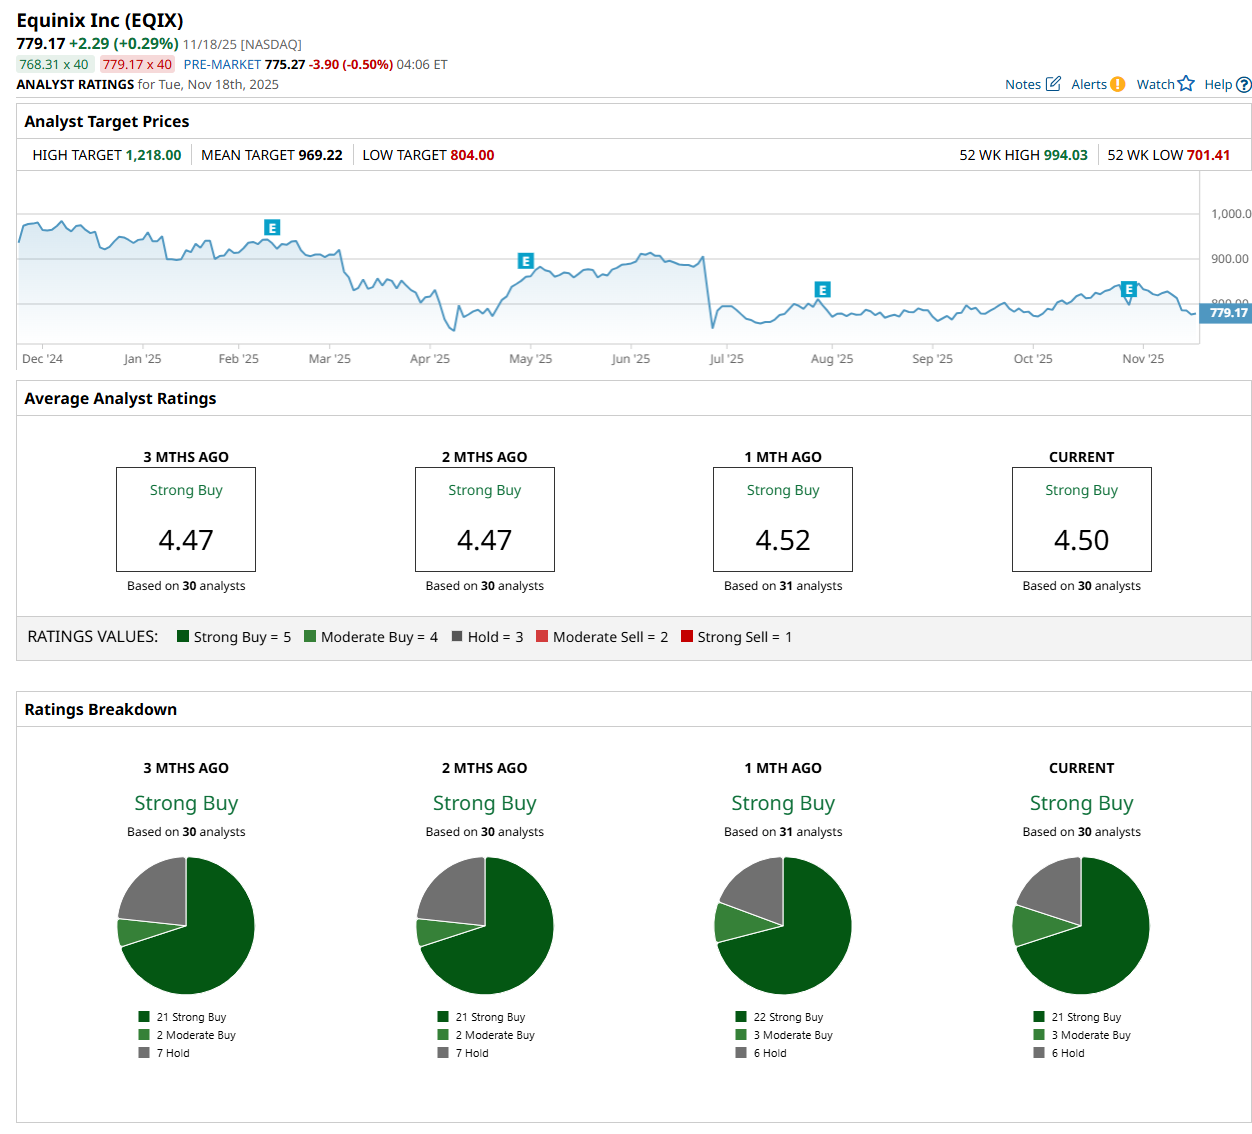
This configuration is slightly less bullish than a month ago, with 22 analysts suggesting a “Strong Buy” rating. 

On Nov. 10, Andy Yu CFA from DBS maintained a "Buy" rating on EQIX, with a price target of $1,218, the Street-high price target, indicating an ambitious 56.3% potential upside from the current levels. 

The mean price target of $969.22 represents a 24.4% premium from EQIX’s current price levels. 


On the date of publication, Neharika Jain did not have (either directly or indirectly) positions in any of the securities mentioned in this article. All information and data in this article is solely for informational purposes. For more information please view the Barchart Disclosure Policy here.


More news from Barchart

Recent Quotes

View More
Symbol Price Change (%)
AMZN  222.69
+0.00 (0.00%)
AAPL  268.56
+0.00 (0.00%)
AMD  223.55
+0.00 (0.00%)
BAC  52.02
+0.00 (0.00%)
GOOG  292.99
+0.00 (0.00%)
META  590.32
+0.00 (0.00%)
MSFT  487.05
-0.07 (-0.01%)
NVDA  186.52
+0.00 (0.00%)
ORCL  225.53
+0.00 (0.00%)
TSLA  403.99
+0.00 (0.00%)
Stock Quote API & Stock News API supplied by www.cloudquote.io
Quotes delayed at least 20 minutes.
By accessing this page, you agree to the Privacy Policy and Terms Of Service.


IntelligentValue Home
Close Window

DISCLAIMER

All content herein is issued solely for informational purposes and is not to be construed as an offer to sell or the solicitation of an offer to buy, nor should it be interpreted as a recommendation to buy, hold or sell (short or otherwise) any security.  All opinions, analyses, and information included herein are based on sources believed to be reliable, but no representation or warranty of any kind, expressed or implied, is made including but not limited to any representation or warranty concerning accuracy, completeness, correctness, timeliness or appropriateness. We undertake no obligation to update such opinions, analysis or information. You should independently verify all information contained on this website. Some information is based on analysis of past performance or hypothetical performance results, which have inherent limitations. We make no representation that any particular equity or strategy will or is likely to achieve profits or losses similar to those shown. Shareholders, employees, writers, contractors, and affiliates associated with ETFOptimize.com may have ownership positions in the securities that are mentioned. If you are not sure if ETFs, algorithmic investing, or a particular investment is right for you, you are urged to consult with a Registered Investment Advisor (RIA). Neither this website nor anyone associated with producing its content are Registered Investment Advisors, and no attempt is made herein to substitute for personalized, professional investment advice. Neither ETFOptimize.com, Global Alpha Investments, Inc., nor its employees, service providers, associates, or affiliates are responsible for any investment losses you may incur as a result of using the information provided herein. Remember that past investment returns may not be indicative of future returns.

Copyright © 1998-2017 ETFOptimize.com, a publication of Optimized Investments, Inc. All rights reserved.