Technically, the S&P 500 fell to a new 4-week low this week, theoretically moving the Index into a secondary (intermediate-term) downtrend based on the Four-Week Rule.
Seasonally, the Index tends to stay steady to strong during December meaning a secondary downtrend would be contra-seasonal indicating fundamentals are more bearish than usual.
Join 200K+ Subscribers: Find out why the midday Barchart Brief newsletter is a must-read for thousands daily.One way of looking at fundamentals would be interest rates, with the Fed fund futures forward curve indicating additional rate cuts could be put on hold through early 2026.

It has been an interesting week for the S&P 500 index (($INX). After posting a new all-time high of 6,920.34 the last week of October, the Index has fallen to a low of 6,574.32 this week (Tuesday, October 18), a drop of 346.02 (5%). While still a long way from the 20% level that marks a “bear” market, from a technical point of view, the Index took out its previous 4-week low of 6,631.44 from the week of October 3.
What does this tell us? According to John J. Murphy in his book “Technical Analysis of the Futures Market” (pg. 268, 1986 edition):
The Four-Week Rule
The system based on the four-week rule is simplicity itself:
Cover short positions and buy long whenever the price exceeds the highs o the four preceding full calendar weeks.
Liquidate long positions and sell short whenever the price falls below the lows of the four preceding full calendar weeks.

As you know, I’ve thrown out most of what I’ve learned about technical analysis given the rise of algorithm-driven trade (aka Watson). This evolution was based on the idea if computers algorithms weren’t coded to pay attention to classic technical patterns, then there is no reason for us to track them either. However, some of the factors used in the equations are volatility and momentum, with the latter indicated by moves to new 4-week highs and lows. Given this, and as you’ve likely noticed in Weekly (intermediate-term) and Monthly (long-term) Analysis, I still use the Four-Week Rule.

What does it mean this time? We’ll see. Theoretically, it could lead to continued selling of stocks, particularly if another interest rate cut by the US Federal Open Market Committee is put on hold at the conclusion of its next meeting (December 16). Speaking of which, midday Thursday finds the December 30-day Fed funds futures contract (ZQZ25) priced at 96.175, indicating a rate of 3.825%, within the current range of 3.75% to 4.0% following the most recent 25-basis point rate cut. Looking ahead, the January contract (ZQF26) is priced at 96.236, indicating a rate of 3.764%, also within the current range.
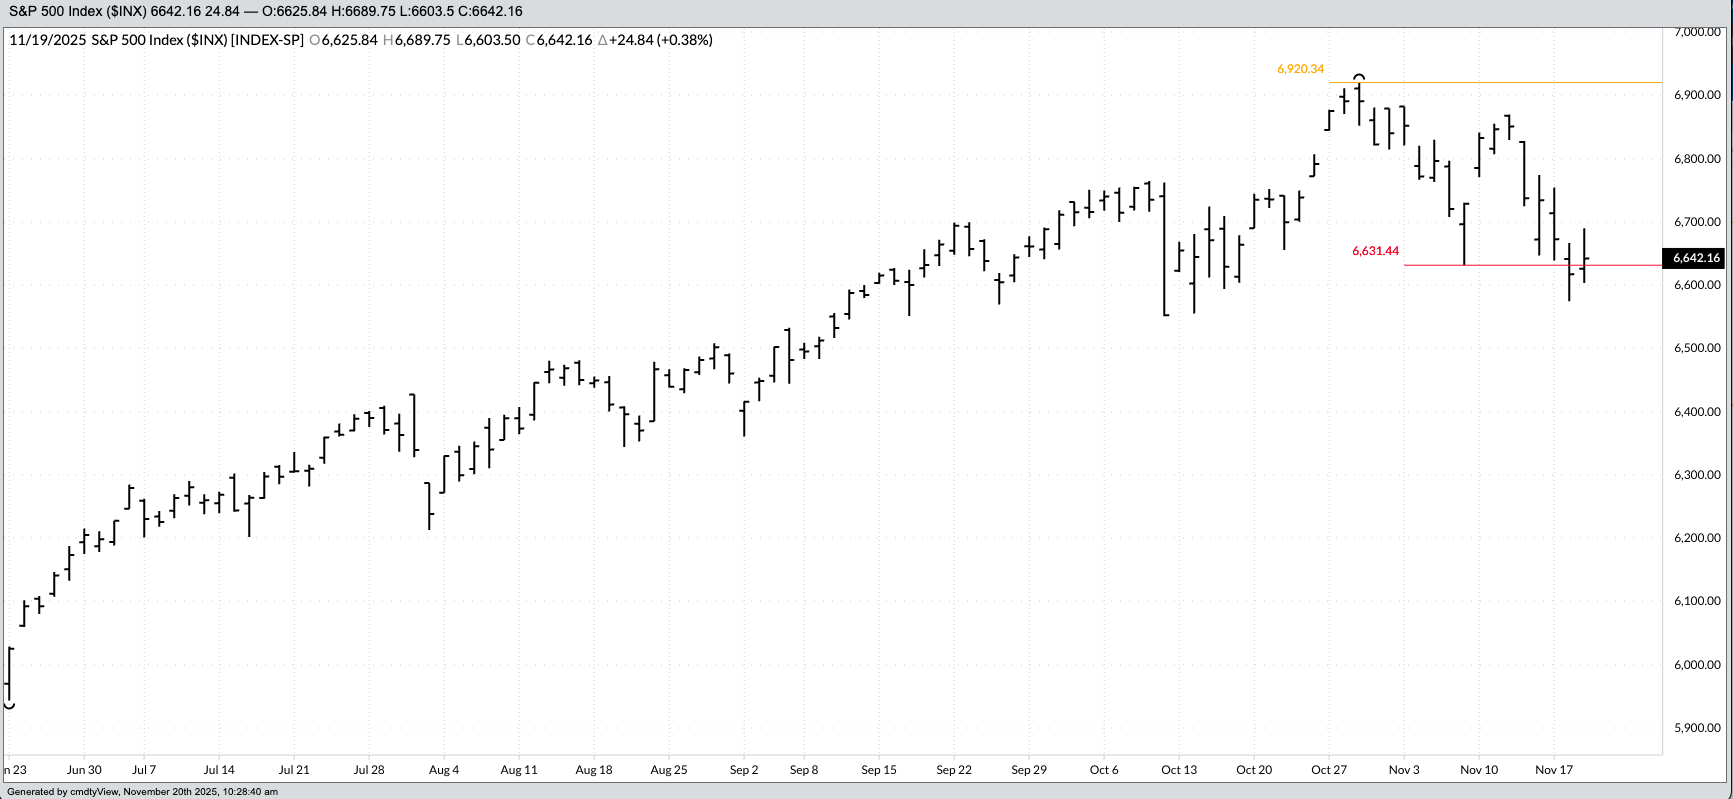
The initial reaction by the S&P 500 after hitting this week’s low has been a rally as the Index climbed to close Tuesday at 6,617.32 before rallying to a Wednesday high of 6,603.50 and settlement of 6,642.16. Thursday has seen the Index climb to a high of 6,770.35 and is sitting near 6,706, up about 64 points at this writing.
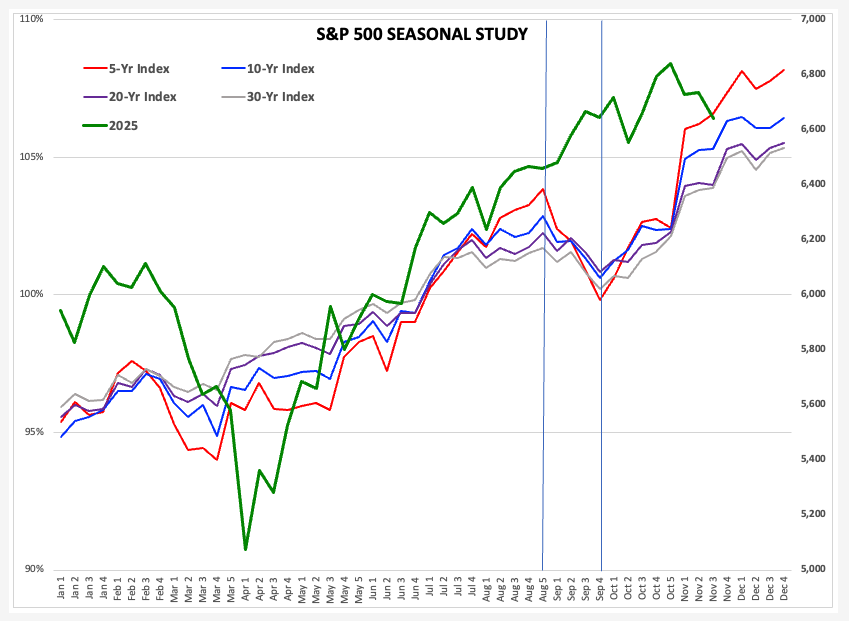
With November nearing its end, what should we expect from the Index based on seasonal analysis? The 5-year, 10-year, 20-year, and 30-year patterns all show the Index tends to continue to firm during December.
- The 5-year seasonal index shows a gain of 1%
- The 10-year seasonal index shows a fractional gain at best
- The 20-year seasonal index shows a 1% gain
- The 30-year seasonal index shows also shows a fractional gain
- Keep in mind these are all based on averages so any particular year can be more or less that what the seasonal indexes show.
If the S&P 500 finishes this week below 6,728.80, the weekly close on Friday, November 7, it would be a new 4-week low weekly close. For those of us who use a combination of the Wilhelmi Element (The only price that matters is the close) and the Goldilocks Principle (Daily charts are too hot, monthly charts are too cold, but weekly charts are just right), we would reach the same conclusion based on the Four-Week Rule.
On the date of publication, Darin Newsom did not have (either directly or indirectly) positions in any of the securities mentioned in this article. All information and data in this article is solely for informational purposes. For more information please view the Barchart Disclosure Policy here.


