Every trader has their favorite setups, angles and go-to’s. One of mine is, for lack of a better expression, the “counter trade.” As I define it, I take an index exchange-traded fund (ETF) that looks dreadful to me technically. Then, I try to find some stocks within it which look promising for gains.
My objective is typically to buy an inverse ETF or put option on the index, while buying the stocks within that index which have the best shot to produce gains. My time horizon is weeks, maybe months. And while it is not always easy to find those standouts, when I do, it is well worth it.
The broad stock market looks ill to me. Maybe something will turn that around quickly. But I’m not counting on it. In particular, the Dow Jones Industrial Average ($DOWI) and the Dow Jones Industrials SPDR (DIA) ETF look especially vulnerable to me. That doesn’t mean gains are not possible, only that risk is high.
So my mission, apart from looking at possibly buying an ETF that runs counter to DIA, or buying a put option on it, is to see where the outliers are. That is, the stocks within that tidy 30-member index that might be upside leaders anyway. Even if they simply outperform in a down market, there’s “alpha” and positive return to be had. In a treacherous market like this one, why not look around every corner, and under every rock? I try to.
So with that as the task, here are three Dow Industrials components that I picked out of the 30 in that venerable index. They all have at least a fighting chance to earn a profitable return over the balance of 2025. Here they are.
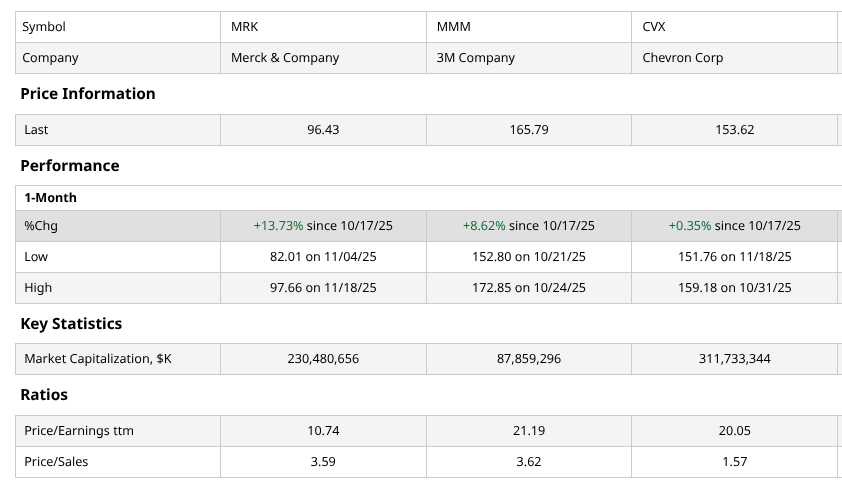
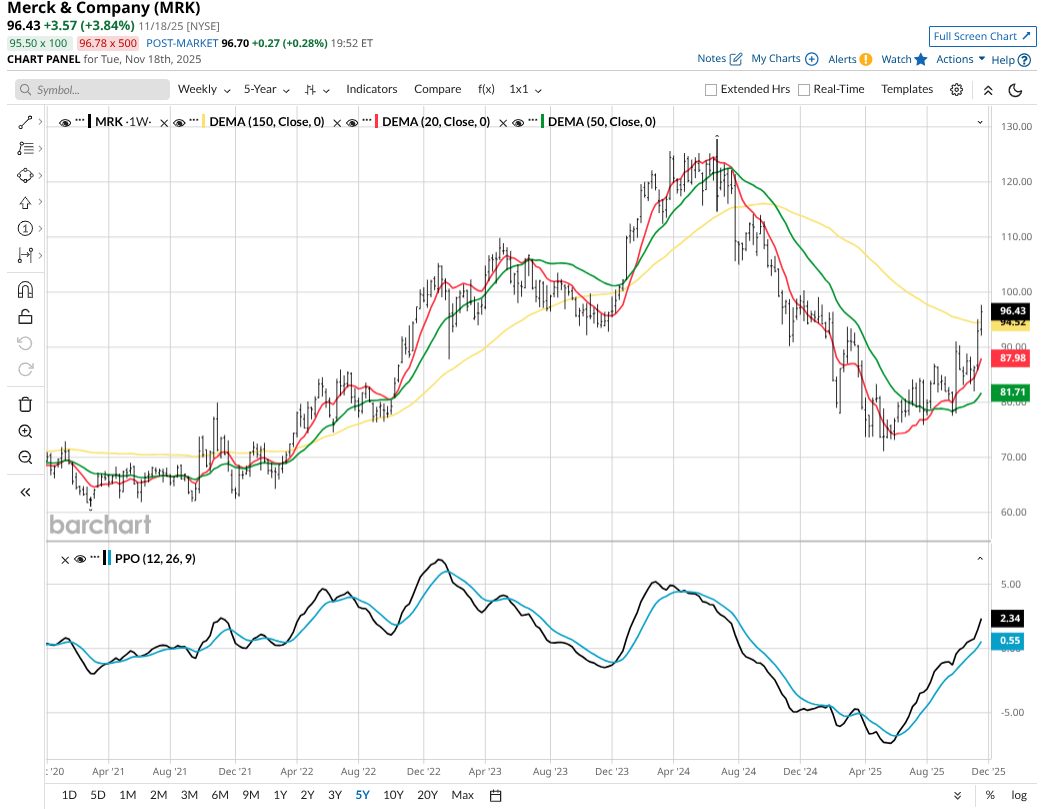
Stock #1: Merck
Merck (MRK) has the best-looking chart in the Dow 30 by far. And it’s about time! It has been languishing amid a range of issues, some related to drug pricing regulation, some to the company’s own maladies. But this is still a blue-chip healthcare firm. And the weekly chart shows promise. An earnings multiple under 11x adds to the attraction here.
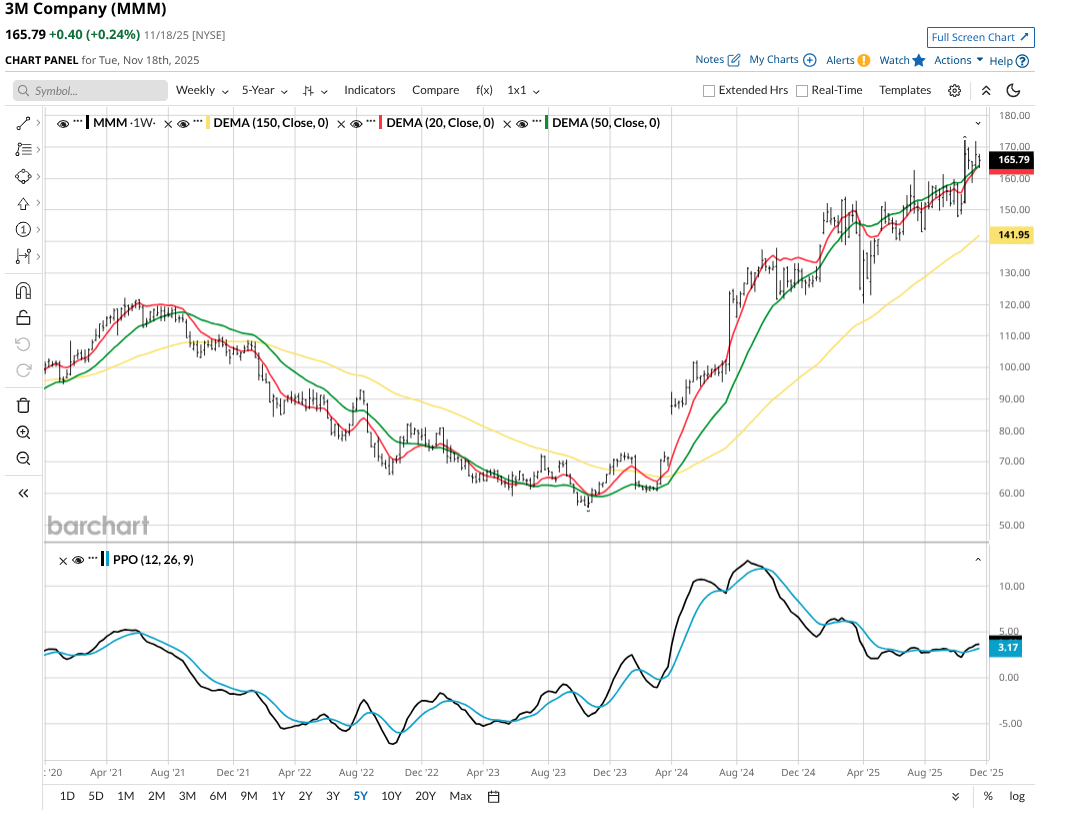
Stock #2: 3M
3M (MMM) has quietly had an outstanding run. And while it is far from undervalued technically, it is a rock-solid blue-chip, if not the most dynamic. 21x earnings is not a steal, but these are times when simply avoiding terrible chart patterns might end up looking like a “win.” The Percentage Price Oscillator (PPO) here is hinting at another leg higher, and MMM is making up for some lost time here.
Stock #3: Chevron
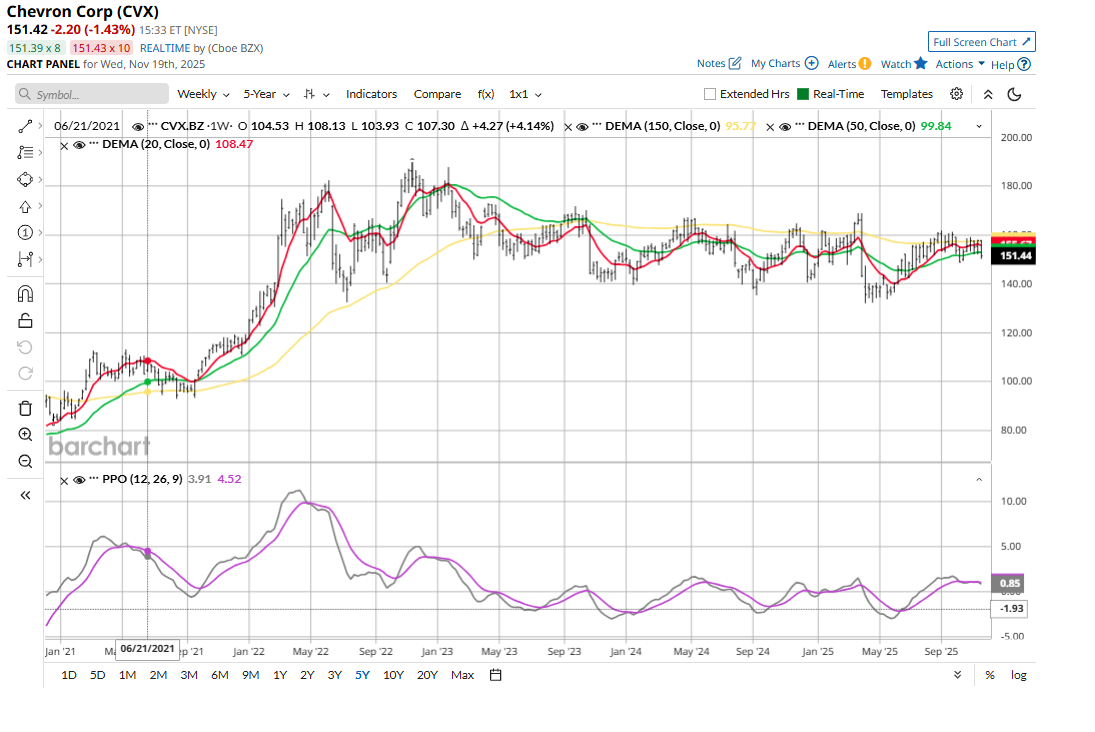
Chevron (CVX) is a good example of the fact that at times like these, a range-bound chart coupled with a price-sales ratio under 2x is a good combination. There’s a nice 4.5% dividend yield here too.
These three stocks all have upside potential. But just as importantly, their charts and valuations are not as risky looking to me as most tech stocks. That alone could be a ticket to success the remainder of this year.
On the date of publication, Rob Isbitts did not have (either directly or indirectly) positions in any of the securities mentioned in this article. All information and data in this article is solely for informational purposes. For more information please view the Barchart Disclosure Policy here.
More news from Barchart
- IonQ Stock is on Discount: Here’s How to Tackle It From a Quantitative Angle
- Burry Calls ‘Fraud’ on Hyperscalers: 4 Pins Set to Pop the AI Bubble and the ‘Big Short’ Math on Big Tech
- The Dow Jones Looks Ready for Death, But These 3 Blue-Chip Stocks Have More Life (and Gains) Ahead
- Jensen Huang Says ‘Blackwell Sales Are Off the Charts, and Cloud GPUs Are Sold Out’ as Nvidia Crushes Q3 Earnings and Beats Analyst Expectations


