- Investors should remain disciplined and continue to plan their work and work their plan amid current market uncertainties.
- Three key issues are highlighted for consideration, with a focus on year-end tax-loss harvesting strategies.
- Tax-loss harvesting can offset capital gains taxes and help preserve portfolio value, especially for short-term gains.
- Caution is advised due to limited visibility on economic and financial data. Avoid information overload to maintain clarity.
Today’s Chart of the Day suggests we divide into two groups:
- Traders who buy stocks and,
- Investors who buy companies
I want you to take a pause and prove you are not a bot.
Remember the old phrase: Plan your work and work your plan? Please continue to do that. Realize that right now there are three issues you need to consider.
Issue #1: Tax-Loss Harvesting
At the end of the year, professional and individual investors look for tax-loss harvesting.
Tax-loss harvesting is the timely selling of securities at a loss to offset the amount of capital gains tax owed from selling profitable assets. This strategy is commonly used to limit short-term capital gains, commonly taxed at a higher rate than long-term capital gains, to preserve the value of the investor’s portfolio while reducing taxes.
Issue #2: Missing Data
At present, we are still operating without economic and financial data. I try not to get sensory overload by looking at so much information that I’m a deer in the headlights and can’t decide which direction to take.
For economic data I look at the Conference Board’s Index of Leading Economic Indicators. At the present time this is their press release:
“Note: Due to the US federal government shutdown, all further releases for The Conference Board Employment Trends Index™ (ETI), The Conference Board−Lightcast Help Wanted OnLine® Index (HWOL Index), The Conference Board Leading Economic Index® of the US (US LEI) and The Conference Board Global Leading Economic Index® (Global LEI) data may be delayed. TCB will resume publication once updated US federal government data are released.”
The last report was on Sept. 18 and was down by 0.5% at that time.
Issue #3: It’s a Trader’s Market
This is a trader’s market, not an investor’s market. Algorithmic trading has taken over a large segment of the trading volume. Algorithmic trading (also called automated trading, black-box trading, or algo-trading) uses a computer program that follows a defined set of instructions (an algorithm) to place a trade. The trade, in theory, can generate profits at a speed and frequency that is impossible for a human trader.
Accept What You Can’t Control
These are things that should concern you, but you must realize they are things you have no control over.
Today I offer two charts. The first is my typical Chart of the Day chart, and the second is my long-term investing chart. In both charts I will use the Vanguard Total Market ETF (VTI).
The first chart is simple. I look at price, the Trend Seeker, the 20-, 50-, 100-, and 200- daily moving averages, and volume:
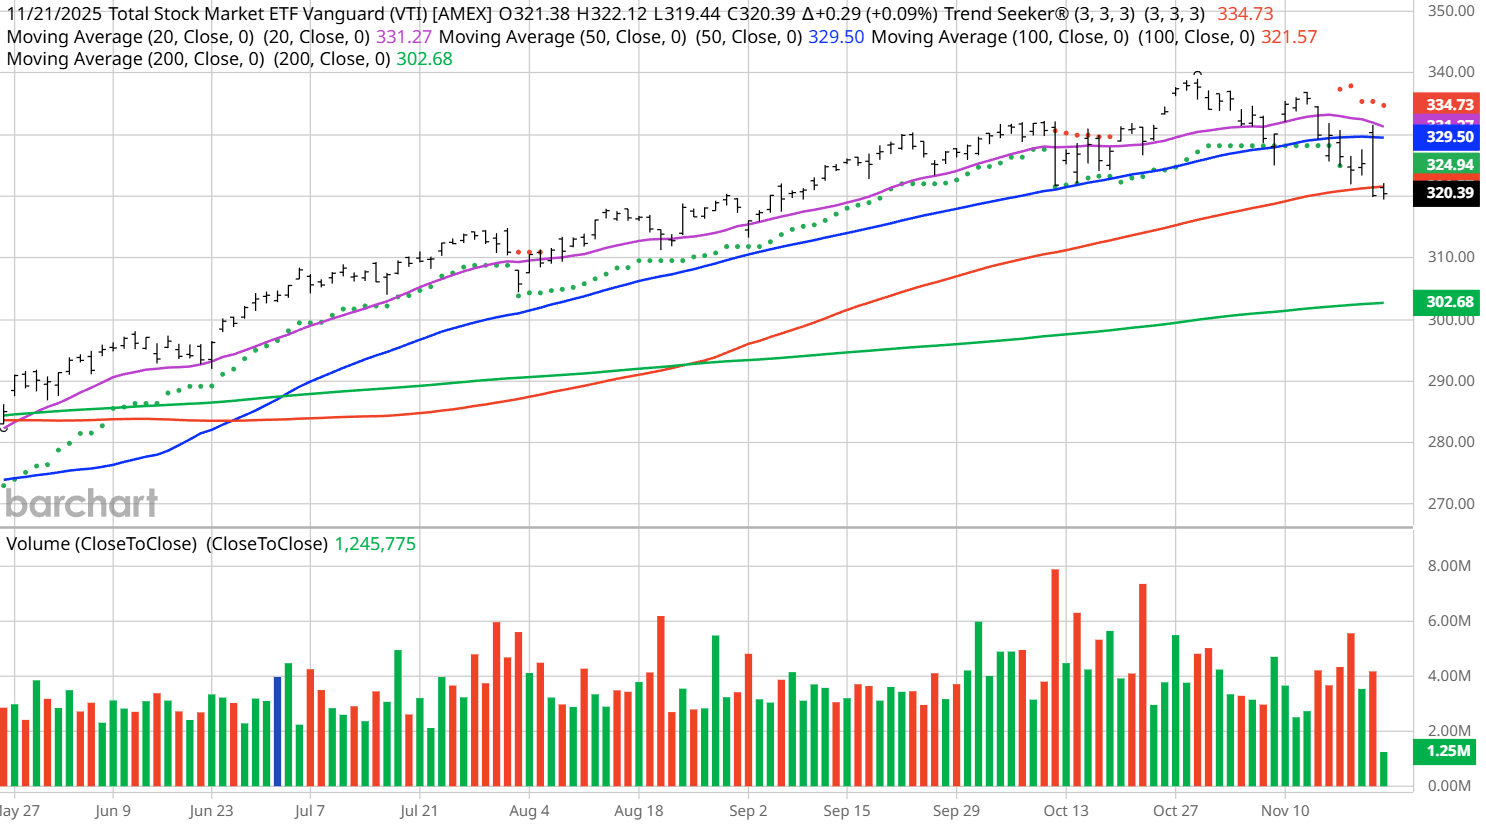
As you can see, although we are currently in a downward trend, we still are only about 5% off our 52-week high of $339.06. I personally make major moves in my portfolios when we are over 10% off the previous 52-week high. Most traders I know have chosen one of these four daily moving averages as their favorite stop-loss triggers.
The second chart uses the same Vanguard Total Market ETF, but now uses weekly data with the price, weekly Trend Seeker, and the 50-week moving average:
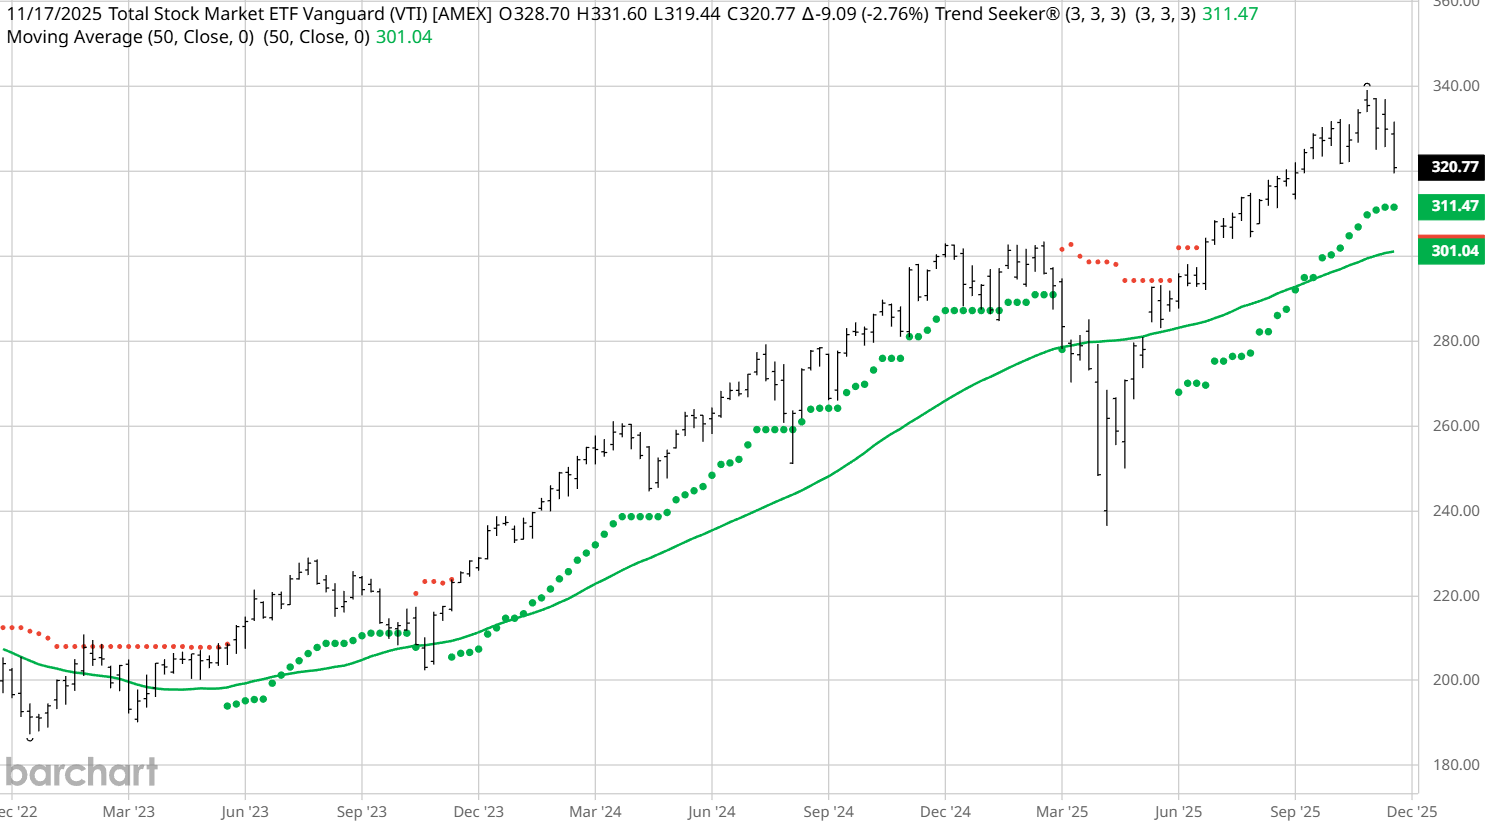
Again, this is the chart I use for companies I want to hold for the long term. As long as they are having increasing revenue and earnings and have not sunk below that 50-week moving average, I’ll hang on.
The Bottom Line
In Summary: We are in a period where we should be concerned, but not a period of panic. Look at those stocks you are trading using the first chart and the companies in which you are investing in terms of the second chart and keep your predetermined stop losses in place.
Trade and invest rationally, not emotionally, and you will be fine.
On the date of publication, Jim Van Meerten did not have (either directly or indirectly) positions in any of the securities mentioned in this article. All information and data in this article is solely for informational purposes. For more information please view the Barchart Disclosure Policy here.
More news from Barchart
- With Earnings Behind It, Nvidia Stock Looks Ripe for Covered Calls
- Bitcoin Prices Are Falling, But MicroStrategy Is Not Sweating the Selloff. MSTR Stock Has a 71-Year Runway, According to Management.
- Eli Lilly Stock Just Joined the $1 Trillion Club. Should You Buy LLY Here?
- 3 Risks Investors Face Right Now and 2 Charts That Should Ease Your Stock Market Panic


