With a market cap of $21.6 billion, Hubbell Incorporated (HUBB) is a global designer, manufacturer, and seller of electrical and utility solutions serving industrial, commercial, institutional, and utility markets. Operating through its Electrical Solutions and Utility Solutions segments, the company provides a wide range of wiring devices, lighting and control systems, and utility infrastructure products under well-known brands such as Hubbell, Burndy, and Aclara.
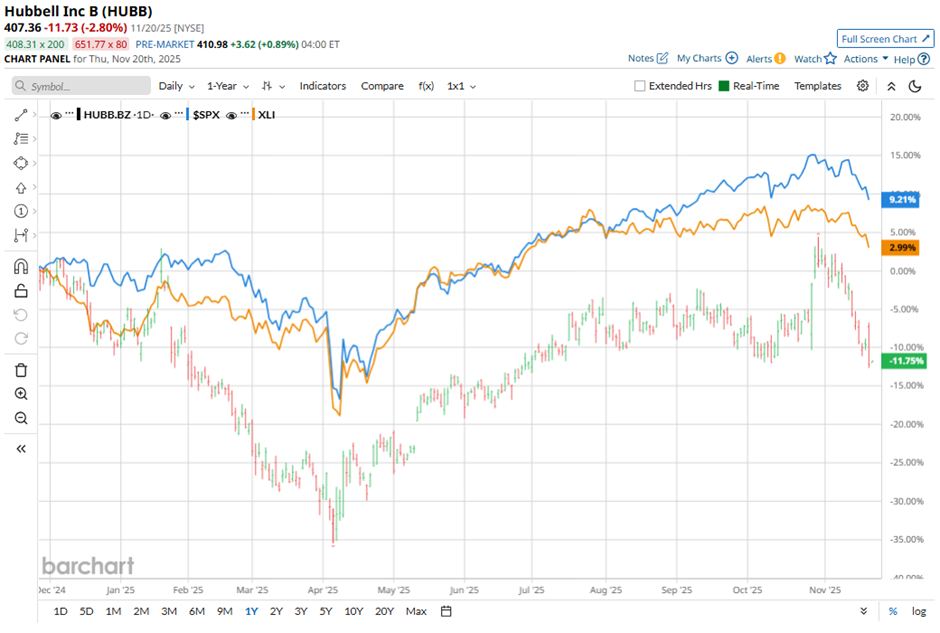
Shares of the Shelton, Connecticut-based company have lagged behind the broader market over the past 52 weeks. HUBB stock has dipped 10.6% over this time frame, while the broader S&P 500 Index ($SPX) has rallied 10.5%. In addition, shares of the company are down 2.6% on a YTD basis, compared to SPX’s 11.2% gain over the same period.
Focusing more closely, shares of the electrical products manufacturer have underperformed the Industrial Select Sector SPDR Fund’s (XLI) 5.6% return over the past 52 weeks.
Despite weaker-than-expected Q3 2025 revenue of $1.5 billion, shares of HUBB soared 4.9% on Oct. 28 as the company posted adjusted EPS of $5.17, exceeding estimates. Investors were encouraged by Hubbell’s decision to raise full-year adjusted EPS guidance to $18.10 - $18.30. Confidence was also supported by strong data-center-driven demand, highlighted by a 10% increase in Electrical segment sales to $559 million.
For the fiscal year ending in December 2025, analysts expect HUBB’s adjusted EPS to grow 9.6% year-over-year to $18.16. The company's earnings surprise history is mixed. It topped the consensus estimates in three of the last four quarters while missing on another occasion.
Among the 13 analysts covering the stock, the consensus rating is a “Moderate Buy.” That’s based on six “Strong Buy” ratings and seven “Holds.”
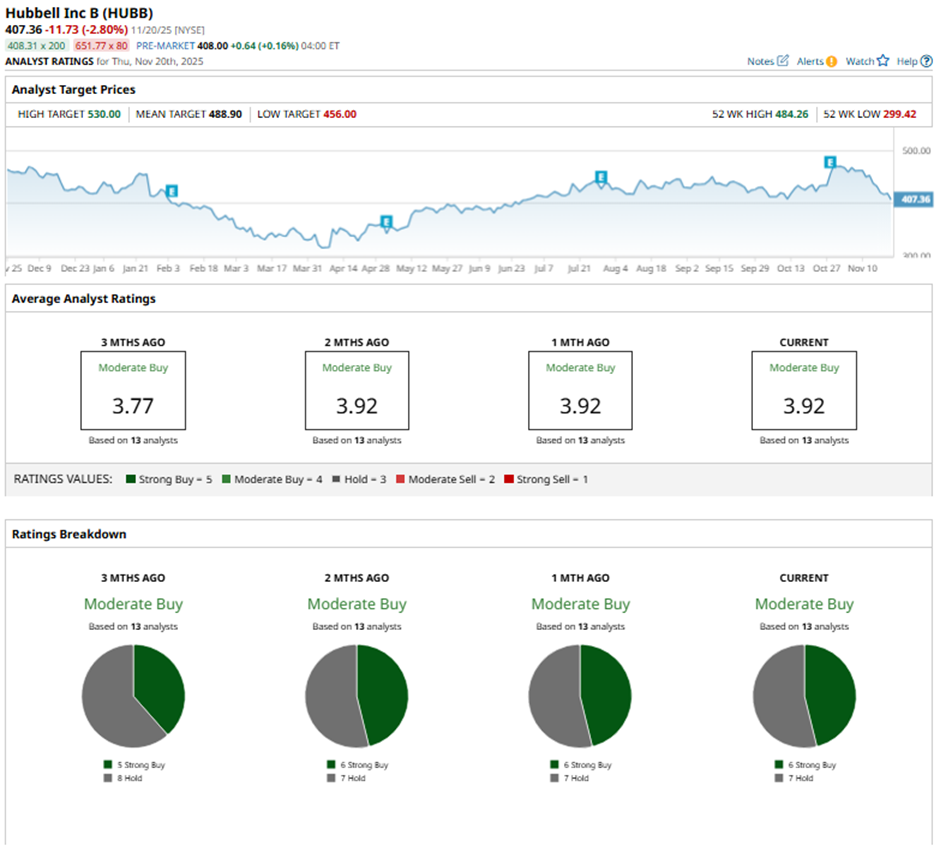
This configuration is slightly more bullish than three months ago, with five “Strong Buy” ratings on the stock.
On Oct. 29, Barclays raised its price target on Hubbell to $456 while maintaining an “Equal Weight” rating.
The mean price target of $488.90 represents a 20% premium to HUBB’s current price levels. The Street-high price target of $530 suggests a 30.1% potential upside.
On the date of publication, Sohini Mondal did not have (either directly or indirectly) positions in any of the securities mentioned in this article. All information and data in this article is solely for informational purposes. For more information please view the Barchart Disclosure Policy here.
More news from Barchart
- Nvidia Just Waved a Big ‘Green Flag’ for Taiwan Semi. Buy TSM Stock Here, Says Wedbush.
- Nvidia’s Growth Engine Is Running Hot — Should You Get On Board?
- Nvidia Stock Breaks 100-Day Moving Average on Q3 Earnings Selloff. Should You Buy the NVDA Dip?
- Nvidia Is a Leader in AI Computing, But Is NVDA Stock a Buy Now?


