Virginia-based Huntington Ingalls Industries, Inc. (HII) is America’s largest military shipbuilder and a major defense contractor. Valued at $12.1 billion by market cap, the company designs, builds, and maintains U.S. Navy vessels, including nuclear-powered aircraft carriers and submarines, through its Newport News and Ingalls shipbuilding divisions. HII also provides mission technologies, including defense systems, cyber solutions, and unmanned technologies.
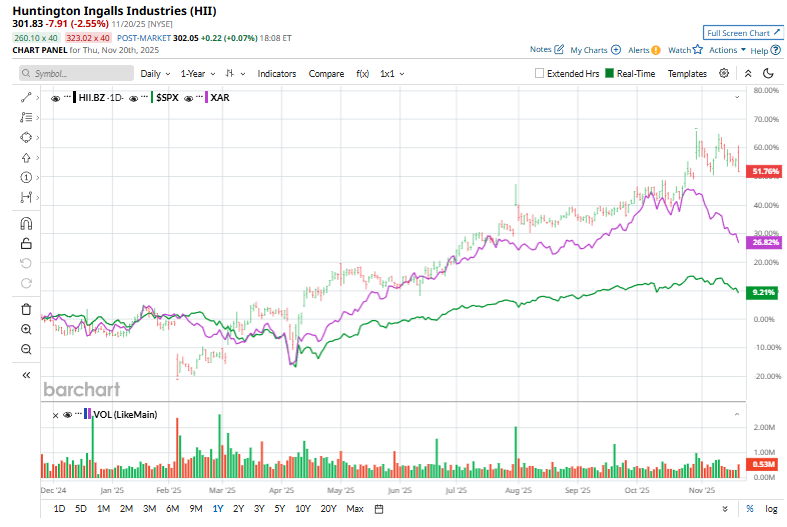
Shares of this largest military shipbuilding company have outperformed the broader market over the past year. HII has rallied 58.7% over this time frame, while the broader S&P 500 Index ($SPX) has rallied nearly 10.5%. Over the past six months, HII stock has been up 32.4%, surpassing the SPX’s 10.1% rise on a YTD basis.
Narrowing the focus, HII has also outpaced the SPDR S&P Aerospace & Defense ETF (XAR). The exchange-traded fund has gained 30.4% over the past year and 16% in 2025.
On Oct. 30, Huntington Ingalls delivered a strong third-quarter earnings report, and the market responded enthusiastically, sending the stock up 6.9%. The company posted $3.2 billion in revenue, up 16.1% year over year, with net earnings rising to $145 million and EPS jumping to $3.68. Shipbuilding margins strengthened meaningfully across both the Ingalls and Newport News divisions, supported by higher volumes in surface combatants, submarines, and aircraft carriers. Mission Technologies also delivered solid growth, helping lift consolidated operating margin to 5%, up from 3% a year earlier. HII secured $2 billion in new contracts, pushing its total backlog to a massive $55.7 billion, while reaffirming and slightly raising its full-year guidance.
For the current fiscal year, ending in December, analysts expect HII’s EPS to grow 7.6% to $15.02 on a diluted basis. The company’s earnings surprise history is mixed. It beat the consensus estimates in three of the last four quarters while missing the forecast on another occasion.
Among the 11 analysts covering HII stock, the consensus is a “Moderate Buy.” That’s based on three “Strong Buy” ratings, seven “Holds,” and one “Moderate Sell.”
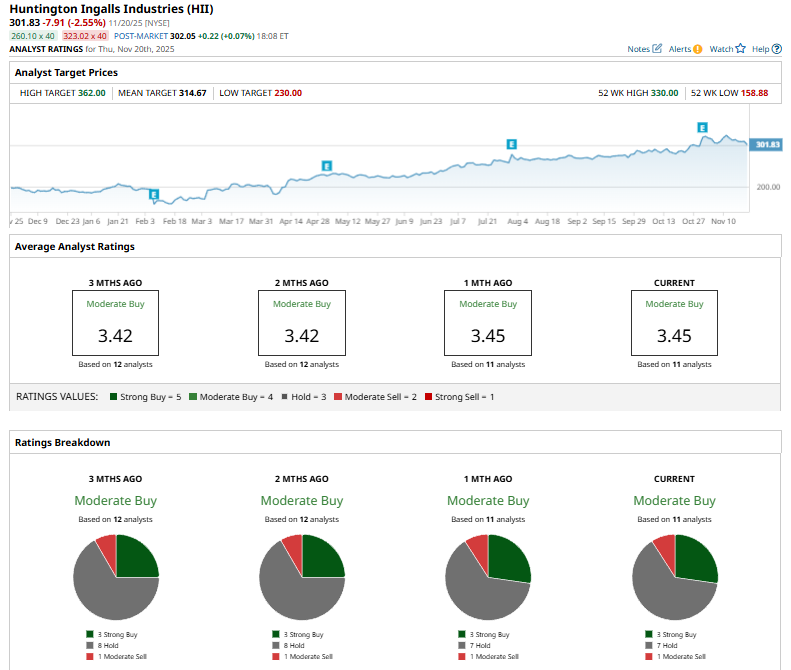
This configuration has been consistent over the past months.
TD Cowen’s Gautam Khanna doubled down on his bullish stance on Oct. 6, reaffirming his “Buy” rating on Huntington Ingalls and backing it with an upbeat $320 price target.
The mean price target of $314.67 represents a 4.3% premium to HII’s current price levels. The Street-high price target of $362 suggests an upside potential of 19.9%.
On the date of publication, Kritika Sarmah did not have (either directly or indirectly) positions in any of the securities mentioned in this article. All information and data in this article is solely for informational purposes. For more information please view the Barchart Disclosure Policy here.
More news from Barchart


