It’s one of those revelations that, once you see it, you can’t unsee it. Basically, 99% of content in the financial publication realm would not technically be considered analysis. Instead, within the scientific community, they would be deemed as opinions cloaked in the language of accounting principles.
To be sure, no methodology that involves forecasting the unknown future can be deemed as factual. However, the core issue with financial analysis — whether that be of the fundamental or technical variety — is that the practitioners are inferring patterns and sequences within locally random noise.
In the book Superforecasting: The Art and Science of Prediction, authors Philip E. Tetlock and Dan Gardner stated that it’s easy for humans to misinterpret randomness, in particular because we lack an inherent intuition for it. Citing the work of psychologist Ellen Langer, the seminal study demonstrated that even the smartest individuals (in this case Yale students) could be duped into believing that they could skillfully predict coin tosses.
To truly understand market behavior, we can’t just look at a company’s singular journey — whether that journey involves income statements or ticker prices — across time. Instead, we must frame price action as a series of trials. Over enough frequencies, certain patterns and densities will invariably pop up.
Further, by using Kolmogorov-Markov frameworks layered with kernel density estimations (KM-KDE), we can measure probability densities — not only of the baseline condition but also under specific stimuli, whether that be accumulative or distributive. Any variance in density can then be utilized for extracting compelling trading ideas.
The reason why I claim that 99% of finpub material is not analytical is that the concept of KDE is virtually nonexistent. Yet KDE provides the very topography to make visual sense of cyclical, stochastic environments.
To be quite blunt, not utilizing KDE to trade — especially options trading — is tantamount to malpractice. You’re already at a disadvantage on Wall Street. Here’s how to take at least some of the power back.
Novo Nordisk (NVO)
Down almost 45% year-to-date, Novo Nordisk (NVO) has attracted a few finpub articles claiming a mispricing or severe undervaluation. However, the question that everyone should start screaming at the top of their lungs is: BASED ON WHAT!? Often, the answer comes down to the author’s assumption of earnings trajectory, cash flows and weighted average cost of capital.
Change the assumption, change the outlook. Since everybody has their own idea of what WACC or any other metric should be, fundamental analysis is entirely contingent on the author. Unfortunately, it’s rather useless, especially when trading options.
I’m not suggesting that quantitative analysis is foolproof because it’s not. I aim to keep the failure rate around 35% but that also means that there is significant risk involved in trading. No system can eliminate risk but we can at least better understand how this risk is distributed.
Using a bespoke algorithm running a KM-KDE framework, we can arrange the forward 10-week returns of NVO stock as a distributional curve, with outcomes ranging between $47.40 and $49 (assuming an anchor price of $47.63, Friday’s close). Further, price clustering would likely be predominant at $48.35.
However, NVO stock is presently structured in a 3-7-D formation; that is, in the past 10 weeks, it printed three up weeks, seven down weeks, with an overall downward slope. Under this sequence, price clustering would be expected to occur at $50.50.
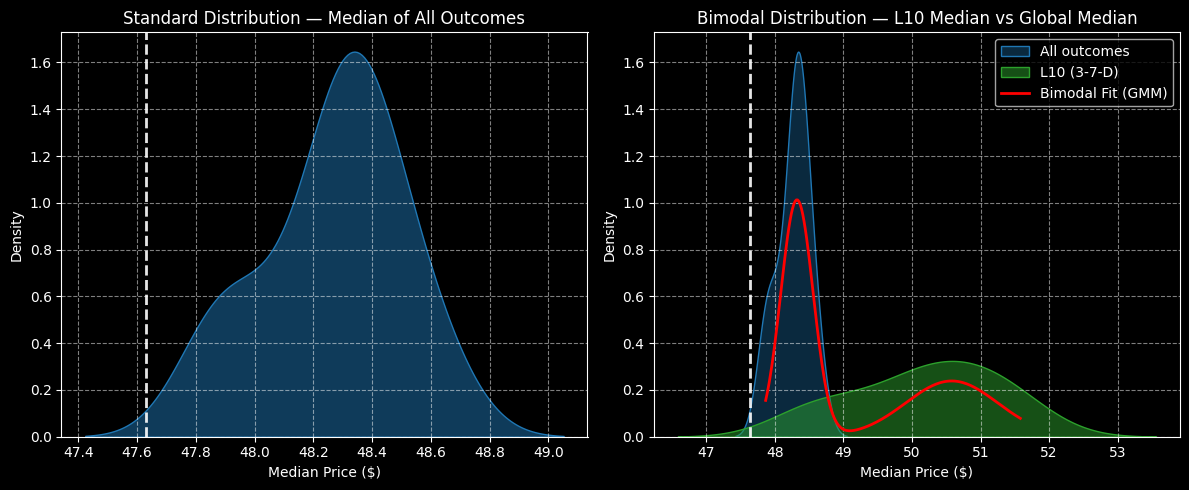
Using data from Barchart Premier, we then pick the vertical spread that best aligns with the risk-reward profile at hand. Some might consider the 45/50 bull call spread expiring Jan. 16, 2026, as the second-leg strike should fall right where the density distribution is thickest.
SoFi Technologies (SOFI)
Financial technology (fintech) giant SoFi Technologies (SOFI) has enjoyed the opposite dynamic of Novo Nordisk, with shares gaining roughly 64%. However, recent performances have not flattered SOFI stock. In the trailing month, for example, the security dipped by more than 7%. This past week was rough as SOFI lost 9%. Still, a comeback could be in the works.
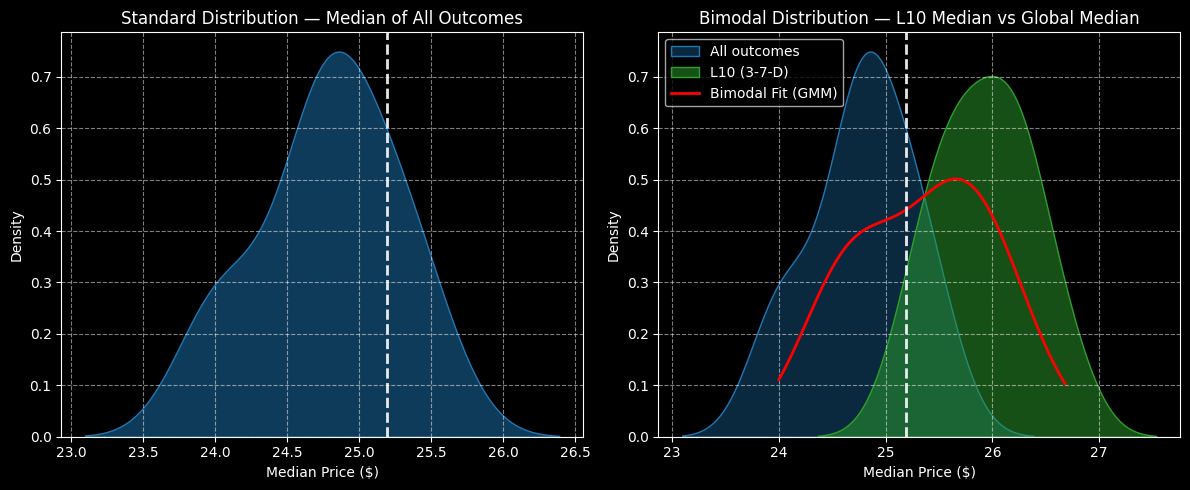
Again, using a bespoke algorithm running a KM-KDE framework, the forward 10-week median returns of SOFI stock would be expected to land between $23 and $26.50 (assuming an anchor price of $25.19). Further, price clustering may be most predominant at $24.80, thus indicating a negative bias.
The above assessment aggregates all sequences since SoFi’s public market debut. However, we’re interested in a specific signal, which is the 3-7-D: three up weeks, seven down weeks, with an overall downward slope. Under this sequence, the forward 10-week returns would likely range between $24.50 and $27.70. Most importantly, price clustering would likely be predominant at $26.
One could take the 25/26 bull spread expiring Jan. 16, which would lead to a very solid maximum payout of 92.31% if SOFI stock triggers the second-leg strike. That’s a very reasonable proposition given the expected density dynamics.
However, those who want to stretch may consider the 25/27 bull spread, also expiring Jan. 16. This trade would offer a payout exceeding 117% if the second strike is triggered, which is extremely ambitious but doable.
Fastenal (FAST)
A supply chain solutions company, Fastenal (FAST) is a key cog in the industrial and construction ecosystems. While FAST stock has gained nearly 11% since the start of the year, its recent performances have not been encouraging. In the trailing month, it’s down more than 6%. Since early September, the security has plunged almost 21%.
Still, from a quantitative perspective, traders could soon have a reversal on their hands. Using the KM-KDE approach, the forward 10-week median returns of FAST stock would be expected to range between $39.30 and $41.50 (assuming an anchor of $39.91). Further, price clustering would likely materialize at approximately $40.75.
However, we’re not so much interested in the aggregate data but in the current signal, where FAST stock is structured in a 3-7-D formation. Under this sequence, the forward 10-week returns would likely land between $39 and $44. Most importantly, price clustering would likely occur at $41.85.
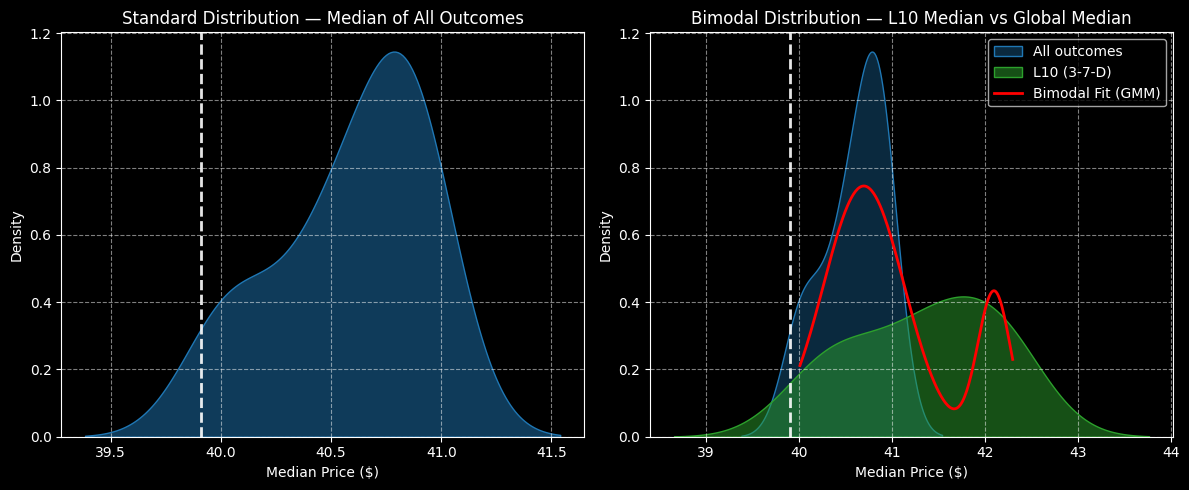
Aggressive traders may want to take a look at the 40.00/42.50 bull spread expiring Dec. 19. For one thing, the higher-leg strike is within the distributional curve of likely outcomes. Second, the breakeven price of $40.95 makes this trade quite enticing for extreme speculators.
On the date of publication, Josh Enomoto did not have (either directly or indirectly) positions in any of the securities mentioned in this article. All information and data in this article is solely for informational purposes. For more information please view the Barchart Disclosure Policy here.
More news from Barchart
- The Saturday Spread: Using Data Science to Pick Out the Most Compelling Discounts (NVO, SOFI, FAST)
- With Earnings Behind It, Nvidia Stock Looks Ripe for Covered Calls
- 3 Simple Options Strategies to Act on Thursday’s Unusual Activity Now
- ConocoPhillips' 3.84% Dividend Yield Implies COP Stock Could be 24% Undervalued


