Headquartered in San Jose, California, Cadence Design Systems, Inc. (CDNS) is an electronic systems design company that uses its Intelligent System Design strategy to turn complex ideas into working silicon through software, hardware, and semiconductor Intellectual Property (IP).
Cadence Design holds a market capitalization of nearly $81.8 billion, which secures its position in the “large-cap” arena above the $10 billion benchmark. Its portfolio stretches across Core EDA, Semiconductor IP, and System Design & Analysis tools, giving customers the ability to design and verify semiconductors and the intricate systems wrapped around them.
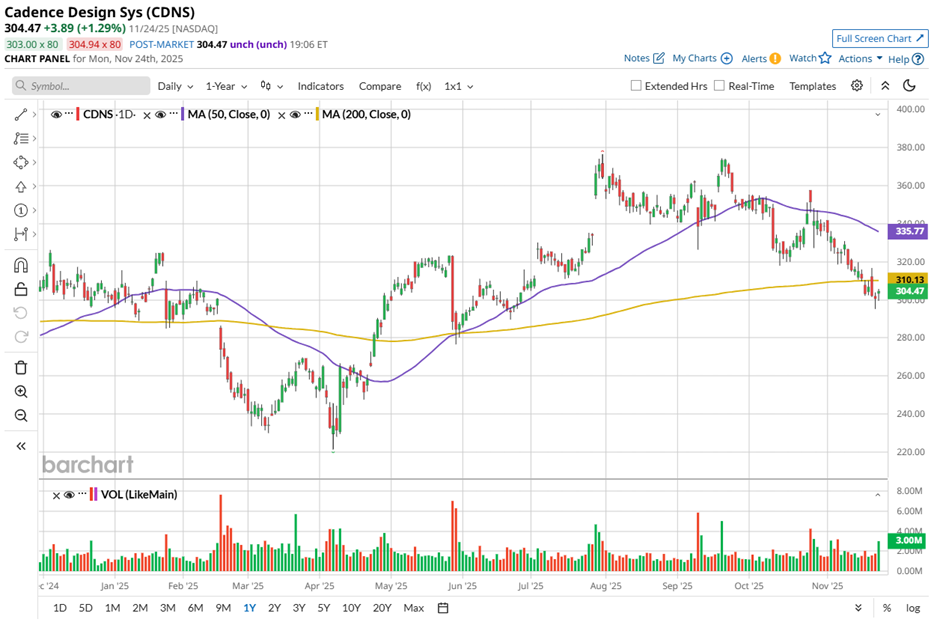
Yet the stock market has not extended the same level of enthusiasm. Shares of Cadence Design have fallen more than 19.1% from its 52-week high of $376.45 set in July. The stock slipped 12.9% over the past three months while the Nasdaq Composite ($NASX) gained 6.6% in the same stretch.

Performance over the longer horizon offered little comfort. CDNS stock plunged 2.4% over the past 52 weeks, and its year-to-date (YTD) gain settled at only 1.3%. Meanwhile, the Nasdaq climbed 20% over the past year and 18.4% on a YTD basis, which underscores the widening performance gap.
Technical momentum painted the picture even more clearly. CDNS stock is trading below its 50-day and 200-day moving averages. The stock slipped below the 50-day trendline in late September and moved under the 200-day marker by mid-November, which suggests a steady loss of upside momentum.
Even so, CDNS managed to deliver some sparks of hope. On Oct. 27, shares jumped almost 1.8% after the company reported its fiscal 2025 Q3 results that beat Wall Street’s expectations on both the top and bottom line. Cadence Design posted revenue of $1.34 billion, up 10.1% year over year (YoY) and above Street’s forecasts. Its adjusted EPS rose 17.7% annually to $1.93, surpassing Wall Street expectations. Plus, strong financial execution contributed to a Q3 backlog of $7 billion during the quarter.
With a record pipeline and broad-based demand across its business, management has raised its full-year revenue outlook to approximately 14% annual growth. The company now expects full-year fiscal 2025 revenue in the range of $5.26 billion to $5.29 billion. Meanwhile, adjusted EPS is expected to land between $7.02 and $7.08.
A comparison with its rival Autodesk, Inc. (ADSK) adds to the narrative. ADSK stock plunged 9.8% over the past 52 weeks and slipped 1.9% YTD, which highlights the stronger competitive position Cadence Design maintains despite its recent stock weakness.
Analysts continue to show confidence. Out of 22 analysts covering CDNS, the consensus rating stands at “Strong Buy.” The mean price target of $384.15 signals a notable premium of 26.2% to current levels and suggests that Wall Street still sees the long-term story as intact.
On the date of publication, Sristi Jayaswal did not have (either directly or indirectly) positions in any of the securities mentioned in this article. All information and data in this article is solely for informational purposes. For more information please view the Barchart Disclosure Policy here.
More news from Barchart