W.W. Grainger, Inc. (GWW), headquartered in Lake Forest, Illinois, distributes maintenance, repair, and operating products and services. Valued at $45.3 billion by market cap, the company's products include motors, HVAC equipment, lighting, hand and power tools, pumps, packaging, material handling, adhesives, safety, janitorial, electrical, and metalworking equipment.
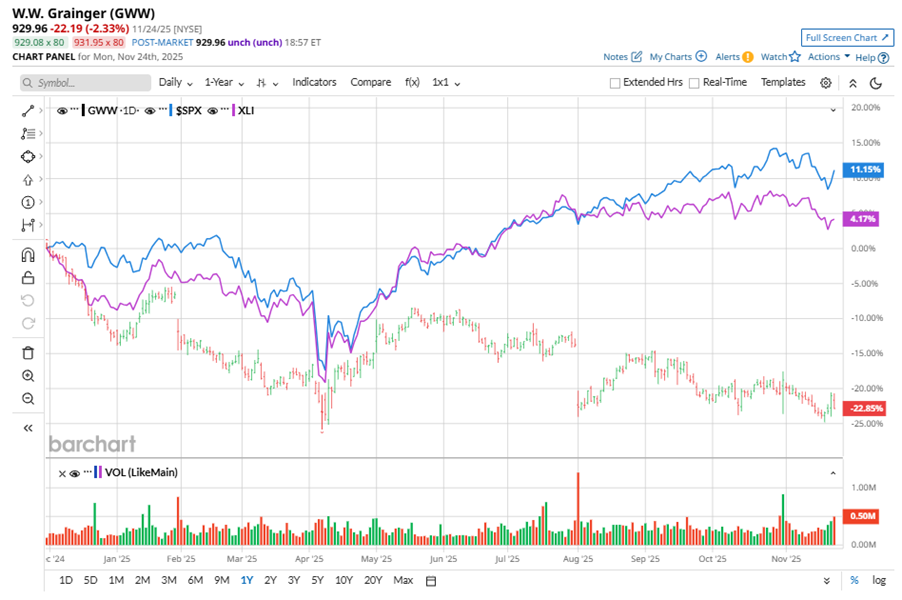
Shares of this MRO giant have underperformed the broader market over the past year. GWW has declined 22.9% over this time frame, while the broader S&P 500 Index ($SPX) has rallied nearly 11%. In 2025, GWW stock is down 11.8%, compared to SPX’s 14% rise on a YTD basis.
Narrowing the focus, GWW’s underperformance is also apparent compared to the Industrial Select Sector SPDR Fund (XLI). The exchange-traded fund has gained about 5.2% over the past year. Moreover, the ETF’s 13.8% gains on a YTD basis outshine the stock’s losses over the same time frame.
GWW faced headwinds from inflation and tariffs, impacting margins despite steady demand. Productivity initiatives and price hikes helped offset costs. The company is streamlining its portfolio, exiting the UK business, and investing in digital transformation to drive growth and improve profitability.
On Oct. 31, GWW shares closed up more than 2% after reporting its Q3 results. Its adjusted EPS of $10.21 surpassed Wall Street expectations of $9.93. The company’s revenue was $4.7 billion, topping Wall Street's $4.6 billion forecast. GWW expects full-year adjusted EPS in the range of $39 to $39.75, and revenue in the range of $17.8 billion to $18 billion.
For the current fiscal year, ending in December, analysts expect GWW’s EPS to grow 1.3% to $39.46 on a diluted basis. The company’s earnings surprise history is mixed. It beat the consensus estimate in two of the last four quarters while missing the forecast on two other occasions.
Among the 19 analysts covering GWW stock, the consensus is a “Hold.” That’s based on three “Strong Buy” ratings, 13 “Holds,” one “Moderate Sell,” and two “Strong Sells.”
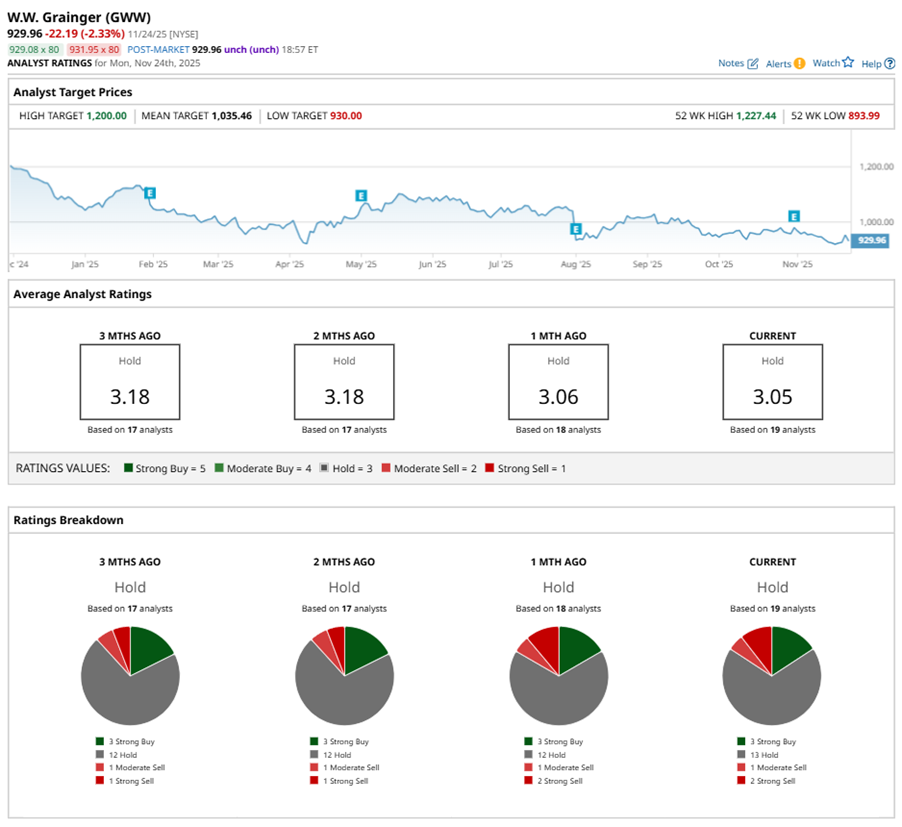
This configuration is more bearish than two months ago, with one analyst suggesting a “Strong Sell.”
On Nov. 12, Bernstein initiated coverage of GWW with a “Market Perform” rating and $975 price target, implying a potential upside of 4.8% from current levels.
The mean price target of $1,035.46 represents an 11.3% premium to GWW’s current price levels. The Street-high price target of $1,200 suggests a notable upside potential of 29%.
On the date of publication, Neha Panjwani did not have (either directly or indirectly) positions in any of the securities mentioned in this article. All information and data in this article is solely for informational purposes. For more information please view the Barchart Disclosure Policy here.
More news from Barchart


