Headquartered in Atlanta, Georgia, The Home Depot, Inc. (HD) is a major home improvement chain operating big-box warehouse stores that provide construction supplies, renovation products, and installation services for homeowners and professional contractors. Its network includes numerous locations throughout the U.S., Canada, and Mexico, supported by robust logistics and merchandising operations. With a market capitalization of $335.03 billion, the company is considered a “mega-cap” stock.
Due to softer market expectations for housing and home improvement spending, Home Depot’s stock has been down. The stock had reached a 52-week low of $326.31 back in April, but is up 7.6% from that level. Over the past three months, the stock has dropped 14.1%. On the other hand, the Nasdaq Composite ($NASX) index gained 7.4% over the same period.
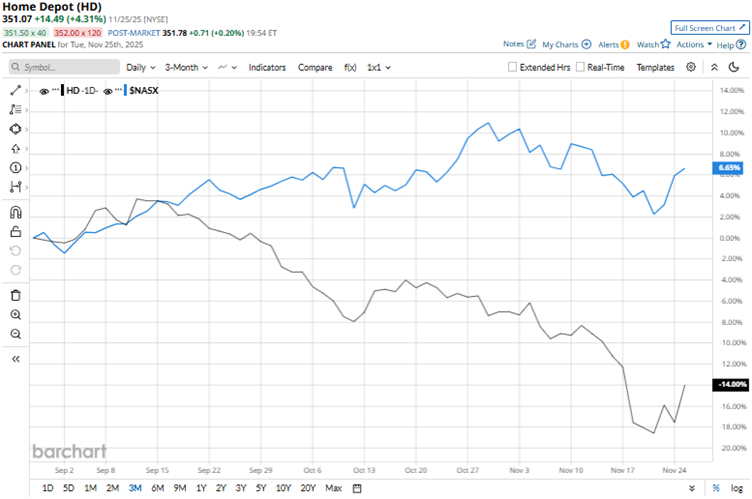
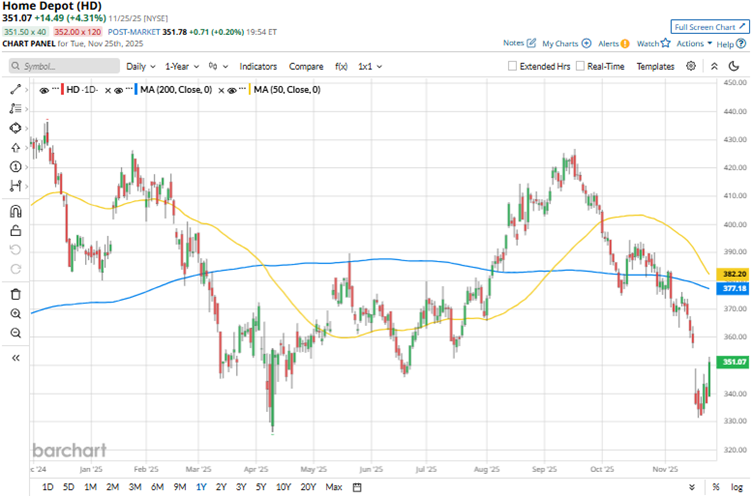
Over the longer term, this underperformance persists. Over the past 52 weeks, Home Depot’s stock declined by 18.1%, while it is down 3.2% over the past six months. On the other hand, the Nasdaq Composite gained 20.8% and 22.9% over the same periods, respectively. Home Depot’s stock has been trading below its 50-day moving average since early October and below its 200-day moving average since early November.
On Nov. 18, Home Depot reported its third-quarter results for fiscal 2025. The company’s revenue increased by a modest 2.8% year-over-year to $41.35 billion, which was marginally higher than the $41.21 billion that Wall Street analysts had expected. Given this subdued topline performance, its adjusted EPS declined 1.1% annually to $3.74, also below the Street’s expected $3.83. Home Depot’s stock dropped 6% intraday on Nov. 18.
Home Depot reported facing a challenging operating backdrop, with a lack of storms weighing specific categories. The company expected to continue facing pressure from a lack of storm activity, ongoing consumer uncertainty, and housing pressure in the fourth quarter as well.
We compare Home Depot’s performance with that of another home improvement retailer, Lowe's Companies, Inc. (LOW), which has dropped 13.5% over the past 52 weeks but gained 7.7% over the past six months. Therefore, Home Depot has been the clear underperformer here.
Wall Street analysts are moderately bullish on Home Depot’s stock. The stock has a consensus rating of “Moderate Buy” from the 35 analysts covering it. The mean price target of $406.68 indicates a 15.8% upside compared to current levels. Moreover, the Street-high price target of $465 indicates a 32.5% upside.
On the date of publication, Anushka Mukherjee did not have (either directly or indirectly) positions in any of the securities mentioned in this article. All information and data in this article is solely for informational purposes. For more information please view the Barchart Disclosure Policy here.
More news from Barchart
- Tesla Stock Is a ‘Must Own’ Now Before ‘Hundreds of Billions in Value’ Changes Hands, According to This 1 Analyst
- Analysts Like Credo Going Into Earnings — Time to Buy CRDO Stock?
- What Dell’s Q3 Numbers Mean for Your Portfolio: Buy, Sell, or Hold?
- Alibaba’s Profits Have Nosedived: Is BABA Still a Buy on AI and Instant Commerce Push?