A large volume of deep out-of-the-money (OTM) put options has traded in Oracle Corp (ORCL). These OTM puts are set to expire in over one year but only work if ORCL stock falls 50%. The activity highlights ORCL's underlying value.
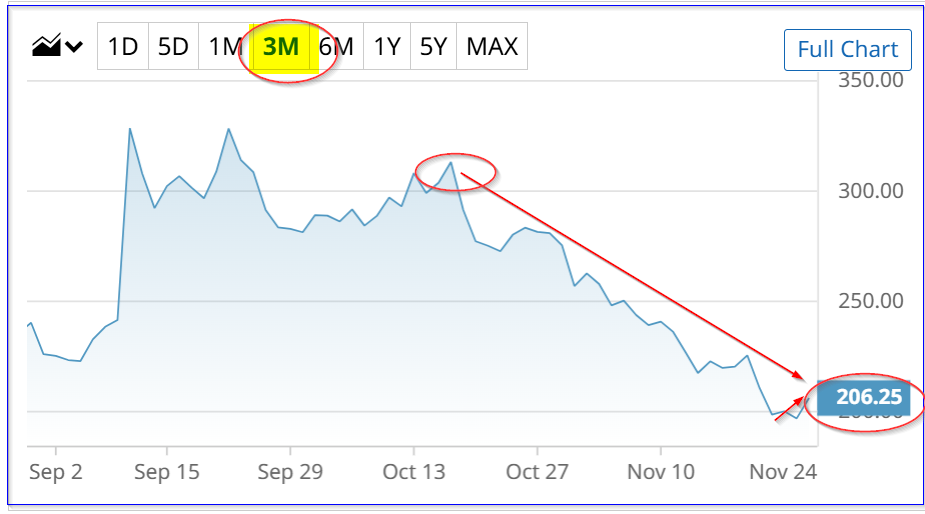
ORCL stock is at $205.21 today, up $8.18, or +4.15% after hitting a recent low of $197.03 yesterday. This is after a recent peak of $313.00 on Oct. 16.
This heavy put option activity might signal it's a good time to buy ORCL stock.
Today's Barchart Unusual Stock Options Activity Report shows this activity. It shows that over 4,300 put contracts have traded that expire in one year (Dec. 18, 2026) at a deep out-of-the-money (OTM) strike price, $105.00.
That is over $100 below today's trading price. It implies that investors buying these puts believe ORCL stock will drop by over 48.7% from today over the next year.

It implies that some investors are very bullish on ORCL stock. But short-sellers of these puts are also making a good income here.
For example, the midpoint premium is $5.40 per put. That implies the short-seller makes a one-year yield of 5.14% (i.e., $5.40/ $105.00).
That is a very attractive return for a bet that has only an 8% chance of working, using the delta ratio of -0.0798.
So, is ORCL stock really worth 50% less than its price today? Not likely. Let's look at its underlying value.
Negative Free Cash Flow
On Sept. 9, 2025, Oracle Corp reported that revenue rose 12% to $14.926 billion for the quarter ending Aug. 31. Moreover, its operating cash flow (OCF) was up +12.6% on a trailing 12-month (TTM) basis.
However, its free cash flow (FCF) came in as negative $5.88 billion. This was due to soaring capex spending, from $7.855 billion last year to $27.414 billion in the latest TTM period.
This can be seen in Oracle's table below.
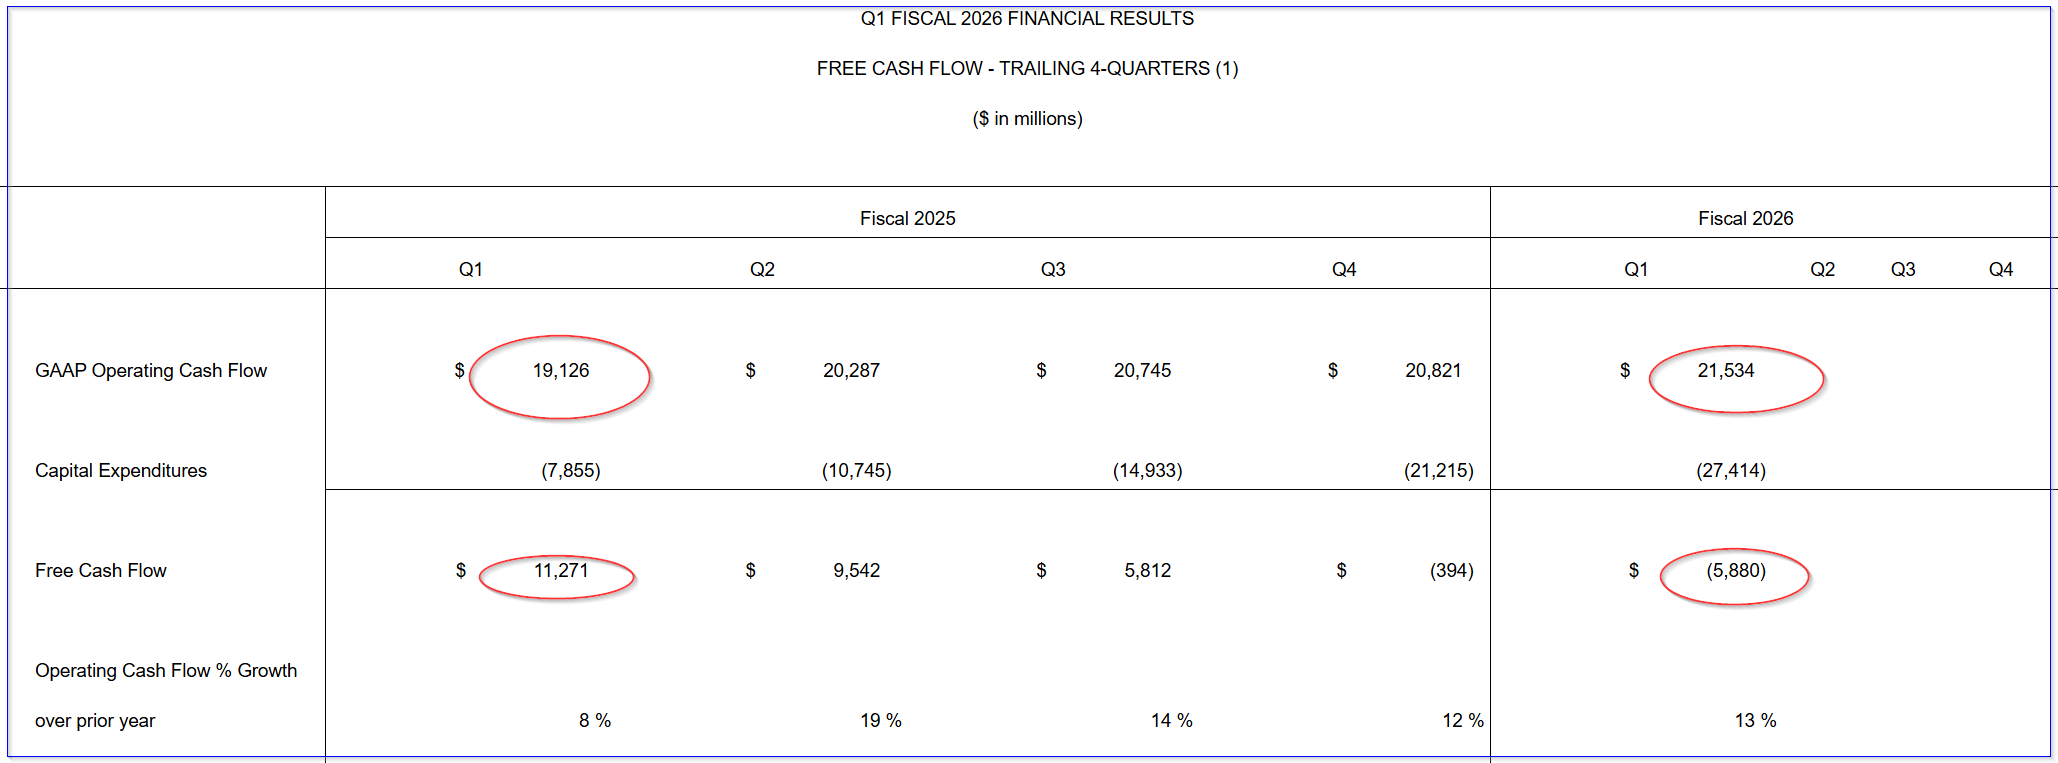
The point is that the company is investing heavily in its AI-related operations. For example, in Q1 its capex spend was $8.5 billion, compared to $2.3 billion a year ago.
That $8.5 billion completely ate up the $8.14 billion in Q1 operating cash flow, leaving FCF in Q1 of -$362 million.
Valuing ORCL Stock
But that negative does not imply that the value of the stock has fallen. Oracle obviously believes that its capex investments will pay off in the long run.
So, one way to value the stock is to use its OCF margins. For example, last quarter its OCF of $8.14 billion represented 54.5% of its almost $15 billion in revenue.
And over the trailing 12 months, the $21.5 billion in OCF represented a 36.4% margin of its $59 billion in TTM revenue. So, recently, its OCF margins have been rising.
We can use that margin to project its future OCF margin. For example, analysts now project revenue of $16.2 billion for its November 30 quarter (announcement due on Dec. 8).
Moreover, for the year ending May 30, analysts project revenue of $67.01 billion and $83.52 billion for the following year. That implies the next 12 months (NTM) revenue of $75.265 billion.
So, applying a conservative 45.5% FCF margin estimate (the average of the past quarter and its TTM figure), OCF could be $34.2 billion (i.e., $75.265b x 0.455).
That allows us to project its future market value. For example, given Oracle's market cap today of $586.2 billion, its TTM OCF represents a 3.67% OCF yield:
$21.534 billion/$586.2 billion mkt cap = 0.0367 = 3.67% OCF yield
Therefore, applying this to our $34.2 billion OCF estimate:
$34.2 billion OCF est. / 0.0367 = $931 billion market cap
That represents a potential gain of +58.8% over today's market value. In other words, ORCL stock is worth $325.87 per share:
$205.21 x 1.588 = $325.87 price target
This is similar to what analysts are saying. For example, the average of 42 analysts surveyed by Yahoo! Finance is $342.28. Similarly, Barchart's mean survey is $349.46.
The bottom line here is that ORCL stock looks deeply undervalued.
That could be one reason why some investors are shorting these out-of-the-money (OTM) one-year put options.
On the date of publication, Mark R. Hake, CFA did not have (either directly or indirectly) positions in any of the securities mentioned in this article. All information and data in this article is solely for informational purposes. For more information please view the Barchart Disclosure Policy here.
More news from Barchart
- Unusual Activity in Oracle Corp Put Options Highlights ORCL Stock's Value
- NVDA Broken Wing Butterfly Trade Targets A Profit Zone Between 165 and 175
- Lennar’s (LEN) Reality Looks Ugly—But Quant Traders Are Targeting THIS Options Spread
- Occidental Petroleum Could Hike Its Dividend - Price Target is At Least 21% Higher