Valued at a market cap of $73.8 billion, Mondelez International, Inc. (MDLZ) is a leading global snack food and beverage company. Headquartered in Chicago, Illinois, the company operates across multiple regions and offers a diverse portfolio of products, including biscuits, chocolates, gum, candy, beverages, and cheese & grocery items.
Companies valued at $10 billion or more are generally considered "large-cap" stocks, and Mondelez International fits this criterion perfectly. Mondelez distributes its products through supermarket chains, wholesalers, club stores, online retail platforms, and direct-to-consumer channels. It has also collaborated with Post Consumer Brands to launch cookie-inspired breakfast cereals.
However, the Oreo cookies, Cadbury chocolate and Trident gum maker has fallen 19.6% from its 52-week high of $71.15. Over the past three months, its shares have dropped 6.8%, underperforming the broader S&P 500 Index’s ($SPX) 5.1% rise during the same period.
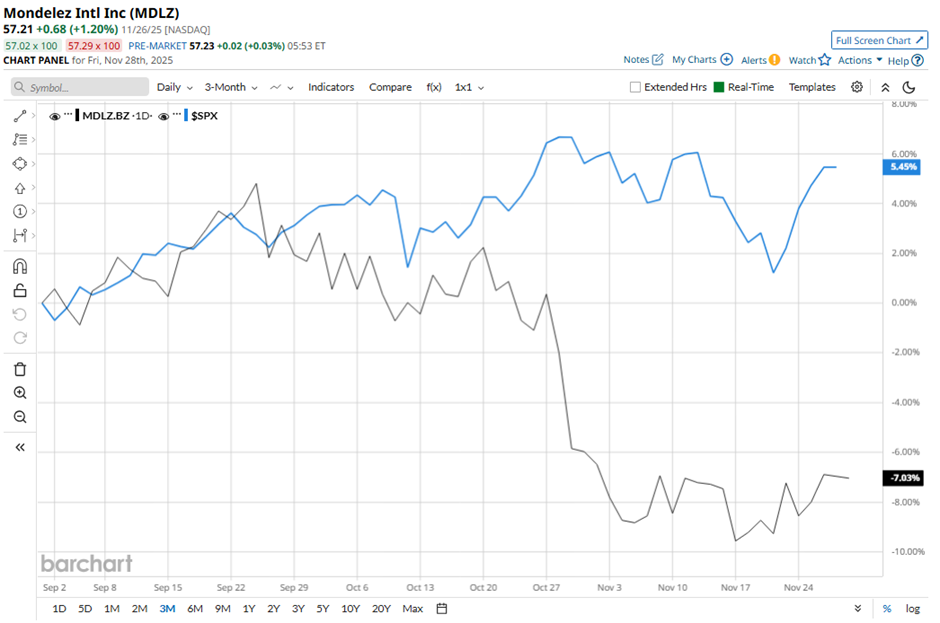
Longer term, shares of the packaged snacks company are down 4.4% on a YTD basis, lagging behind SPX's 15.8% increase. Moreover, shares of Mondelez have declined 12.2% over the past 52 weeks, compared to the 13.6% return of the SPX over the same time frame.
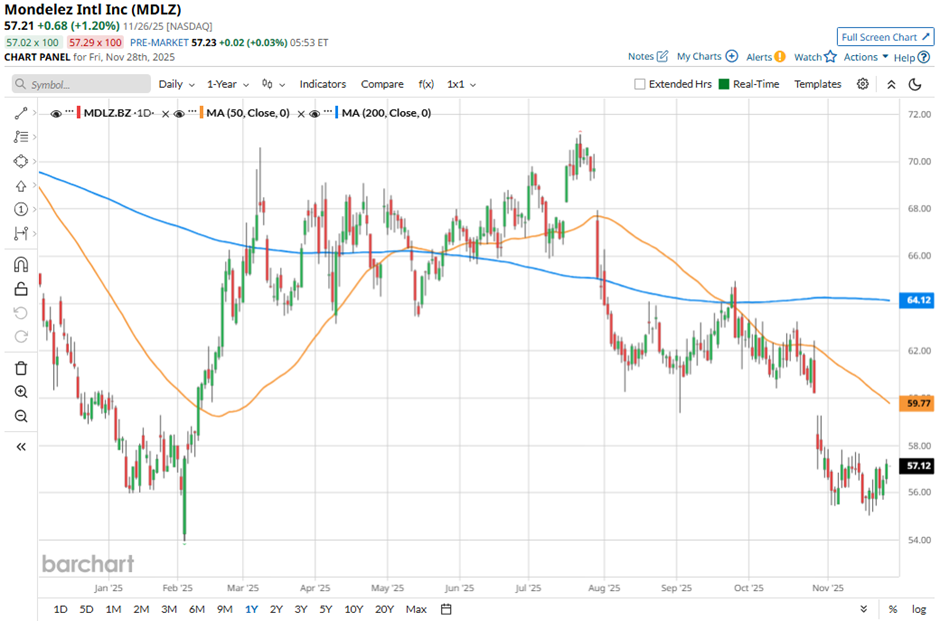
MDLZ has been in a bearish trend, consistently trading below its 50-day and 200-day moving averages since August.
Despite reporting better-than-expected Q3 2025 adjusted EPS of $0.73 on Oct. 28, shares of MDLZ fell 3.9% the next day because the company cut its 2025 profit outlook, warning adjusted EPS would drop about 15% instead of the previously guided 10%. Mondelez also lowered its organic net revenue growth forecast to “4% plus” from about 5%, signaling weakening demand. In addition, volumes deteriorated as inflation, higher cocoa costs, and price-sensitive consumers hurt sales momentum.
In comparison, MDLZ stock has lagged behind its rival, The Hershey Company (HSY). HSY stock has gained 11.1% YTD and 8.6% over the past 52 weeks.
Despite Mondelez’s underperformance, analysts remain moderately optimistic about its prospects. The stock has a consensus rating of “Moderate Buy” from 25 analysts in coverage, and the mean price target of $69 is a premium of 20.6% to current levels.
On the date of publication, Sohini Mondal did not have (either directly or indirectly) positions in any of the securities mentioned in this article. All information and data in this article is solely for informational purposes. For more information please view the Barchart Disclosure Policy here.
More news from Barchart
- This Rare Earths Stock Just Locked Down a New Supply Deal. Should You Buy Shares Here?
- Argus Just Slashed Its Earnings Estimates for Coinbase. Should You Dump COIN Stock Here?
- Big Money is Betting on Natural Gas Prices to Break Out. Here’s the Setup.
- Is This Under-the-Radar High-Yield AI Stock a Buy Now?


