ETFOptimize | High-performance ETF-based Investment Strategies

Quantitative strategies, Wall Street-caliber research, and insightful market analysis since 1998.


ETFOptimize | HOME
Close Window

Are Wall Street Analysts Predicting Southwest Airlines Stock Will Climb or Sink?

Dallas, Texas-based Southwest Airlines Co. (LUV) is a passenger airline company offering scheduled air transportation services in the U.S. and near-international markets. Valued at $15.7 billion by market cap, the company provides in-flight entertainment, the Rapid Rewards loyalty program, digital platforms like SWABIZ for business travel, and extra services including Southwest's EarlyBird Check-In, upgraded boarding, and pet and unaccompanied minor transportation.

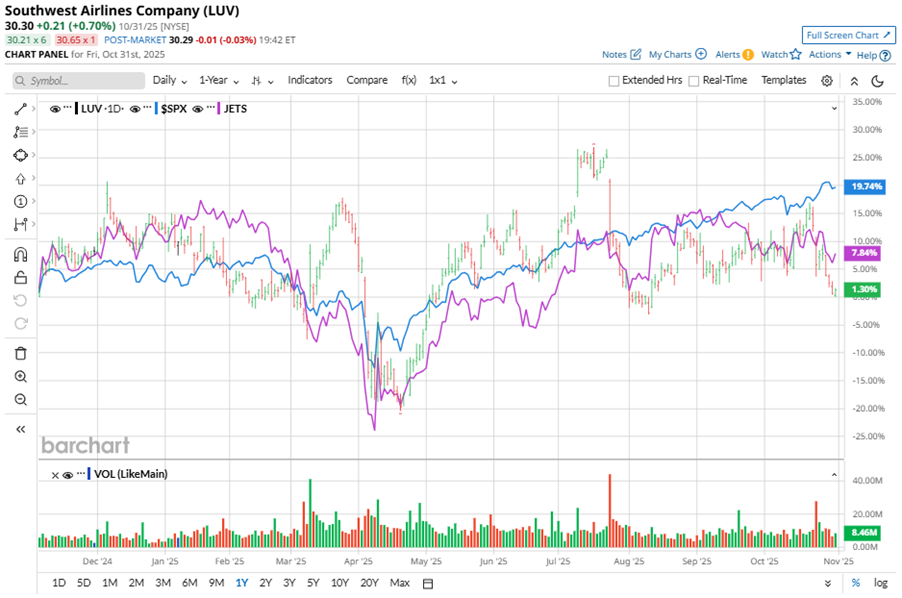
Shares of this airline giant have underperformed the broader market over the past year. LUV has declined 3.7% over this time frame, while the broader S&P 500 Index ($SPX) has rallied nearly 17.7%. In 2025, LUV’s stock fell 9.9%, compared to the SPX’s 16.3% rise on a YTD basis.


Narrowing the focus, LUV’s underperformance is also apparent compared to the U.S. Global Jets ETF (JETS). The exchange-traded fund has gained about 6.8% over the past year. Moreover, the ETF’s 2.8% losses on a YTD basis outshine the stock’s dip over the same time frame. 

www.barchart.com

On Oct. 22, LUV reported its Q3 results, and its shares closed down more than 6% in the following trading session. Its adjusted EPS of $0.11 surpassed Wall Street expectations of $0.01. The company’s revenue was $6.95 billion, missing Wall Street forecasts of $6.97 billion.

For the current fiscal year, ending in December, analysts expect LUV’s EPS to grow 13.5% to $1.09 on a diluted basis. The company’s earnings surprise history is mixed. It beat the consensus estimate in three of the last four quarters while missing the forecast on another occasion.

Among the 21 analysts covering LUV stock, the consensus is a “Hold.” That’s based on four “Strong Buy” ratings, one “Moderate Buy,” 11 “Holds,” one “Moderate Sell,” and four “Strong Sells.”

www.barchart.com

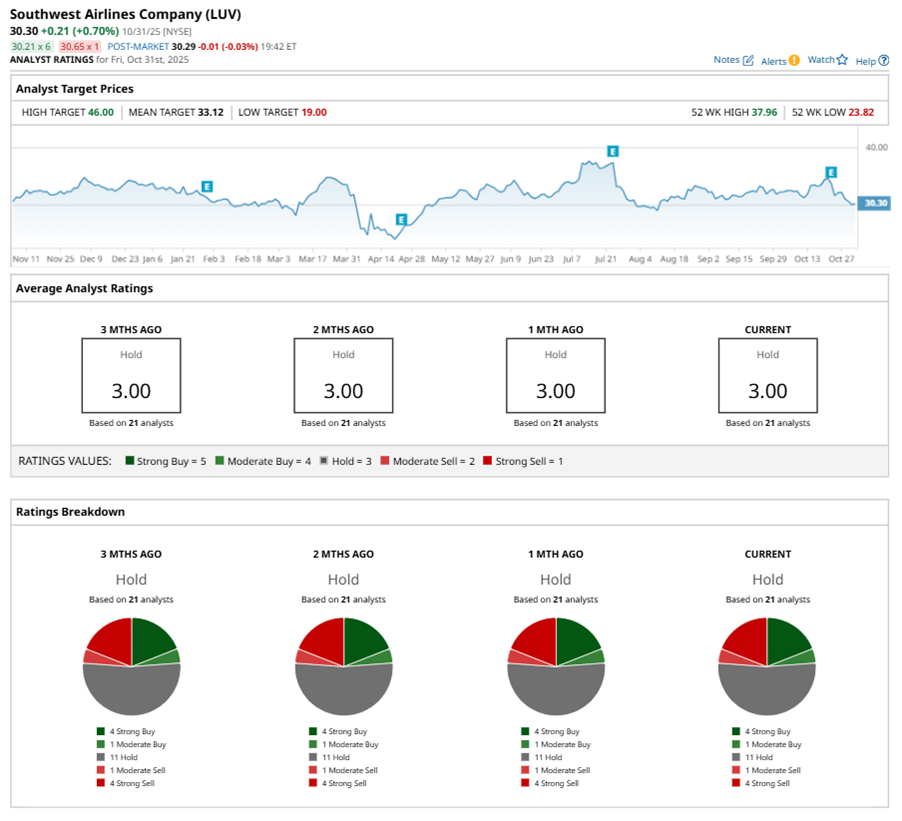
The configuration has been consistent over the past three months. 

On Oct. 24, UBS kept a “Neutral” rating on LUV and lowered the price target to $33, implying a potential upside of 8.9% from current levels.

The mean price target of $33.12 represents a 9.3% premium to LUV’s current price levels. The Street-high price target of $46 suggests an ambitious upside potential of 51.8%. 


On the date of publication, Neha Panjwani did not have (either directly or indirectly) positions in any of the securities mentioned in this article. All information and data in this article is solely for informational purposes. For more information please view the Barchart Disclosure Policy here.


More news from Barchart

Recent Quotes

View More
Symbol Price Change (%)
AMZN  244.41
+1.37 (0.56%)
AAPL  268.47
-1.30 (-0.48%)
AMD  233.54
-4.16 (-1.75%)
BAC  53.20
-0.09 (-0.17%)
GOOG  279.70
-5.64 (-1.98%)
META  621.71
+2.77 (0.45%)
MSFT  496.82
-0.28 (-0.06%)
NVDA  188.15
+0.07 (0.04%)
ORCL  239.26
-4.54 (-1.86%)
TSLA  429.52
-16.39 (-3.68%)
Stock Quote API & Stock News API supplied by www.cloudquote.io
Quotes delayed at least 20 minutes.
By accessing this page, you agree to the Privacy Policy and Terms Of Service.


IntelligentValue Home
Close Window

DISCLAIMER

All content herein is issued solely for informational purposes and is not to be construed as an offer to sell or the solicitation of an offer to buy, nor should it be interpreted as a recommendation to buy, hold or sell (short or otherwise) any security.  All opinions, analyses, and information included herein are based on sources believed to be reliable, but no representation or warranty of any kind, expressed or implied, is made including but not limited to any representation or warranty concerning accuracy, completeness, correctness, timeliness or appropriateness. We undertake no obligation to update such opinions, analysis or information. You should independently verify all information contained on this website. Some information is based on analysis of past performance or hypothetical performance results, which have inherent limitations. We make no representation that any particular equity or strategy will or is likely to achieve profits or losses similar to those shown. Shareholders, employees, writers, contractors, and affiliates associated with ETFOptimize.com may have ownership positions in the securities that are mentioned. If you are not sure if ETFs, algorithmic investing, or a particular investment is right for you, you are urged to consult with a Registered Investment Advisor (RIA). Neither this website nor anyone associated with producing its content are Registered Investment Advisors, and no attempt is made herein to substitute for personalized, professional investment advice. Neither ETFOptimize.com, Global Alpha Investments, Inc., nor its employees, service providers, associates, or affiliates are responsible for any investment losses you may incur as a result of using the information provided herein. Remember that past investment returns may not be indicative of future returns.

Copyright © 1998-2017 ETFOptimize.com, a publication of Optimized Investments, Inc. All rights reserved.