ETFOptimize | High-performance ETF-based Investment Strategies

Quantitative strategies, Wall Street-caliber research, and insightful market analysis since 1998.


ETFOptimize | HOME
Close Window

VICI Properties Stock: Is Wall Street Bullish or Bearish?

New York-based VICI Properties Inc. (VICI) operates as a REIT, engaged in owning, acquiring, and developing gaming, hospitality, and entertainment destinations. With a market cap of approximately $32 billion, VICI owns one of the largest portfolios of market-leading leisure destinations, including Caesars Palace Las Vegas, MGM Grand, and the Venetian Resort Las Vegas.

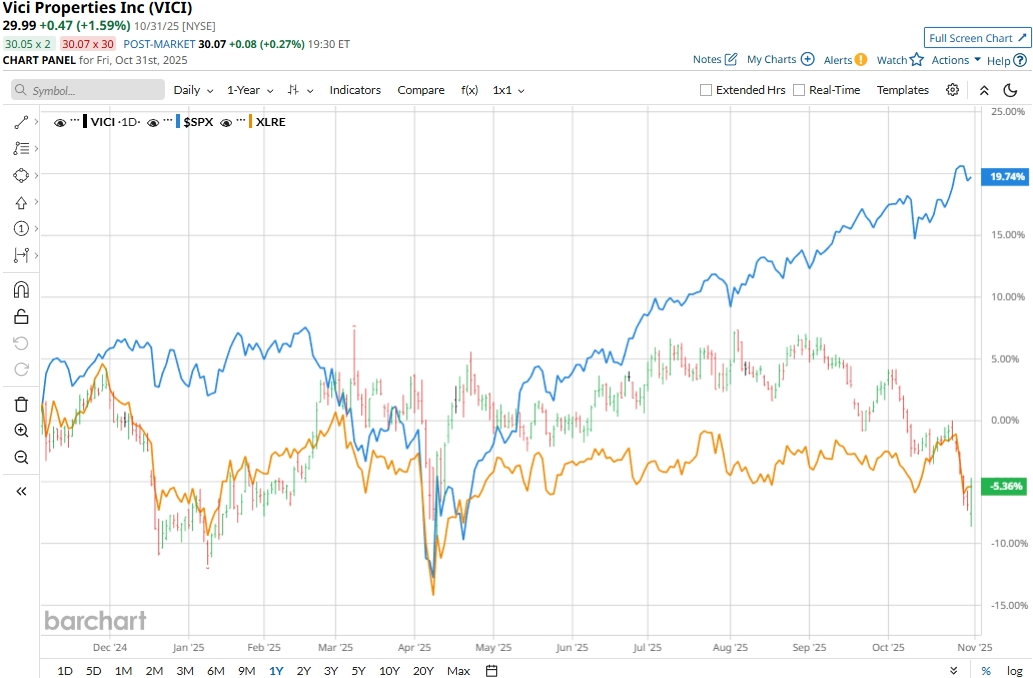
Despite its strengths, the stock has notably underperformed the broader market. VICI stock prices have gained a modest 2.7% on a YTD basis and declined 7.5% over the past 52 weeks, underperforming the S&P 500 Index’s ($SPX) 16.3% gains in 2025 and 17.7% surge over the past year.


Narrowing the focus, VICI has slightly outpaced the sector-focused Real Estate Select Sector SPDR Fund’s (XLREmarginal 57 bps uptick on a YTD basis, but marginally underperformed XLRE’s 7% decline over the past 52 weeks.

www.barchart.com

VICI Properties’ stock prices observed a 1.6% uptick in the trading session following the release of its impressive Q3 results on Oct. 30. The recent drop in VICI’s stock prices can be attributed to the broader downturn in the real estate space. The company’s fundamentals have continued to remain robust, which has been demonstrated by the company’s 7.4% growth in aggregate adjusted funds from operations (AFFO) over the past 12 months, while its share count inched up by just 2.1%.

In Q3, VICI’s topline grew 4.4% year-over-year to $1 billion, exceeding the consensus estimates by 43 bps. Meanwhile, its AFFO per share grew by 5.3% to $0.71, surpassing the Street’s expectations by 1.6%.

For the full fiscal 2025, ending in December, analysts expect VICI to deliver an AFFO of $2.37 per share, up 4.9% year-over-year. Further, the company has a solid AFFO surprise history. It has surpassed the Street’s AFFO estimates in each of the past four quarters.

Among the 23 analysts covering the stock, the consensus rating is a “Strong Buy.” That’s based on 18 “Strong Buys,” one “Moderate Buy,” and four “Holds.”

www.barchart.com

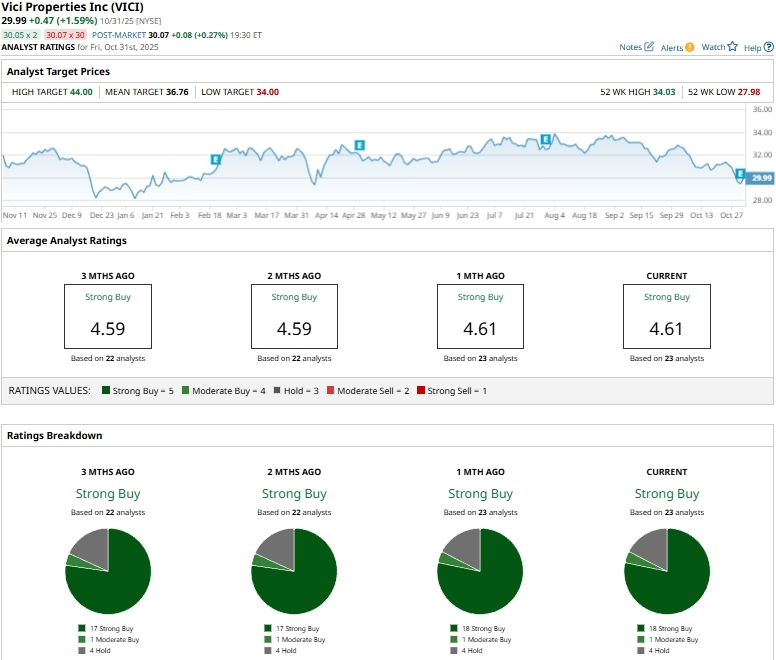
This configuration is slightly more optimistic than two months ago, when 17 analysts gave “Strong Buy” recommendations.

On Oct. 31, Stifel analyst Simon Yarmak maintained a “Buy” rating on VICI, but lowered the price target from $35 to $34.

VICI’s mean price target of $36.76 suggests a 22.6% upside potential. Meanwhile, the street-high target of $44 represents a notable 46.7% premium to current price levels.


On the date of publication, Aditya Sarawgi did not have (either directly or indirectly) positions in any of the securities mentioned in this article. All information and data in this article is solely for informational purposes. For more information please view the Barchart Disclosure Policy here.


More news from Barchart

Recent Quotes

View More
Symbol Price Change (%)
AMZN  248.40
+3.99 (1.63%)
AAPL  269.43
+0.96 (0.36%)
AMD  243.98
+10.44 (4.47%)
BAC  53.42
+0.22 (0.41%)
GOOG  290.59
+10.89 (3.89%)
META  631.76
+10.05 (1.62%)
MSFT  506.00
+9.18 (1.85%)
NVDA  199.05
+10.90 (5.79%)
ORCL  240.83
+1.57 (0.66%)
TSLA  445.23
+15.71 (3.66%)
Stock Quote API & Stock News API supplied by www.cloudquote.io
Quotes delayed at least 20 minutes.
By accessing this page, you agree to the Privacy Policy and Terms Of Service.


IntelligentValue Home
Close Window

DISCLAIMER

All content herein is issued solely for informational purposes and is not to be construed as an offer to sell or the solicitation of an offer to buy, nor should it be interpreted as a recommendation to buy, hold or sell (short or otherwise) any security.  All opinions, analyses, and information included herein are based on sources believed to be reliable, but no representation or warranty of any kind, expressed or implied, is made including but not limited to any representation or warranty concerning accuracy, completeness, correctness, timeliness or appropriateness. We undertake no obligation to update such opinions, analysis or information. You should independently verify all information contained on this website. Some information is based on analysis of past performance or hypothetical performance results, which have inherent limitations. We make no representation that any particular equity or strategy will or is likely to achieve profits or losses similar to those shown. Shareholders, employees, writers, contractors, and affiliates associated with ETFOptimize.com may have ownership positions in the securities that are mentioned. If you are not sure if ETFs, algorithmic investing, or a particular investment is right for you, you are urged to consult with a Registered Investment Advisor (RIA). Neither this website nor anyone associated with producing its content are Registered Investment Advisors, and no attempt is made herein to substitute for personalized, professional investment advice. Neither ETFOptimize.com, Global Alpha Investments, Inc., nor its employees, service providers, associates, or affiliates are responsible for any investment losses you may incur as a result of using the information provided herein. Remember that past investment returns may not be indicative of future returns.

Copyright © 1998-2017 ETFOptimize.com, a publication of Optimized Investments, Inc. All rights reserved.