I last wrote about the dollar index, which measures the world’s reserve currency against the other reserve currencies, on Barchart on September 23, where I wrote:
In early 2026, President Trump will appoint the Fed’s next Chairman, and the current Chair, Jerome Powell, is not a candidate for reappointment. Meanwhile, the President is prepared to appoint new members to the central bank’s voting ranks. Any appointments will likely support the administration’s call for lower short-term rates.
Join 200K+ Subscribers: Find out why the midday Barchart Brief newsletter is a must-read for thousands daily.
With European short-term rates over 2% below the Fed Funds Rate and the prospects for falling U.S. rates in 2026, the bottom line is that the U.S. dollar index could be on a path toward a new low for 2025, and a challenge of longer-term downside technical targets.
At below the 100 level in early November, the dollar index continues to consolidate near the low end of its bearish range for 2025.
A narrow range in the dollar index
The dollar index made lower highs and lower lows from January 13, 2025, through September 17, 2025.
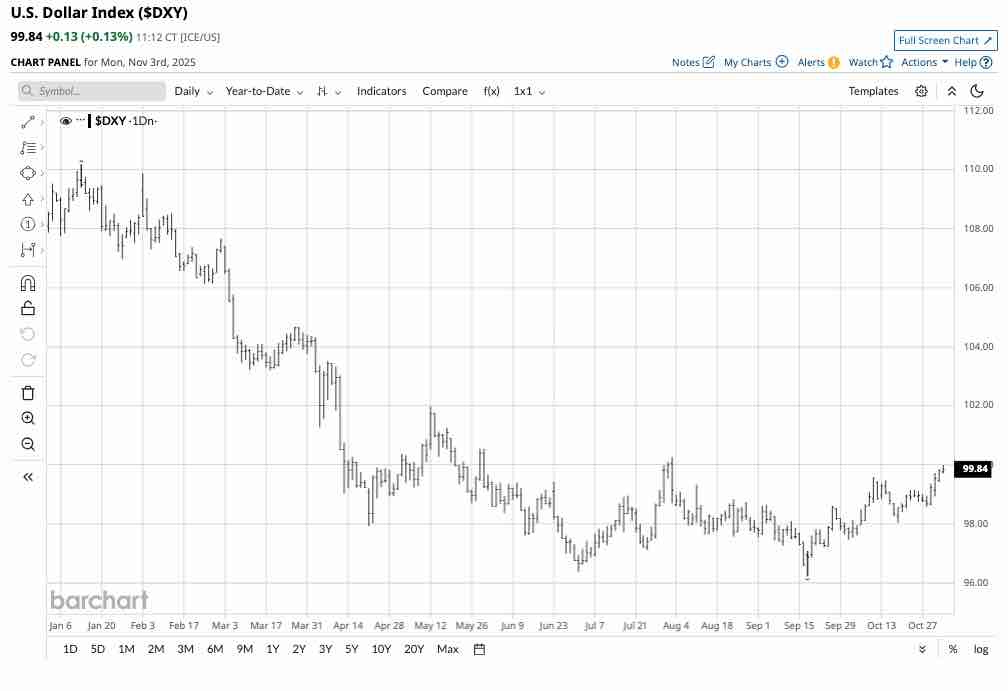
The daily year-to-date chart highlights that while the dollar index has made higher lows and higher highs since the low from September 17, the index has consolidated in a 96.22 to 100.26 range since August 4. The consolidation has been near the bottom end of the 2025 trading range.
The latest inflation data favors lower rates, which is bearish for the dollar index
The September consumer and producer price index data, which hovered around the 3% level, showed that inflationary pressures remain above the Fed’s 2% target but below the current Fed Funds Rate. The Fed cut the rate by another 25 basis points at the late October FOMC meeting. As U.S. rates decline, it narrows the rate differential between the U.S. and other reserve currencies.
Gold has corrected, but it remains elevated- All fiat currencies are losing value
While the U.S. dollar remains the world’s reserve currency, gold has moved into second place, surpassing the euro as the second most widely used currency. Gold’s ascent over the past years reflects the decline in fiat currency values, and the dollar is no exception.
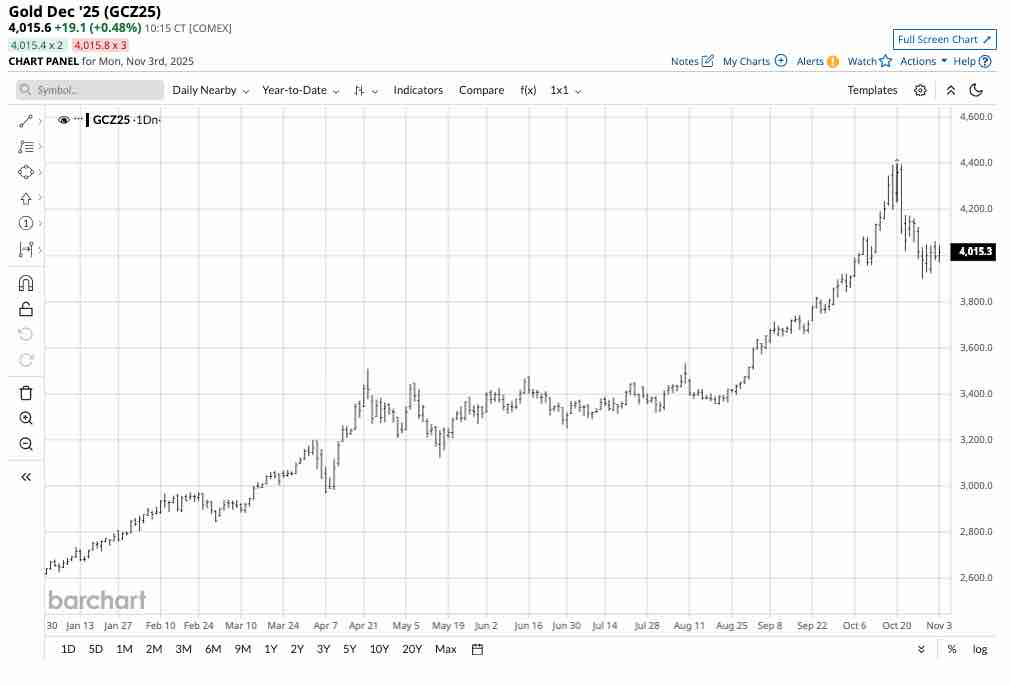
The daily year-to-date chart highlights the ascent of COMEX gold futures that have rallied nearly 59% from the December 31, 2024, closing price of $2,766.90 to the most recent high of $4,398 per ounce. While the gold futures have pulled back to the $4,000 level in early November, they remain nearly 52% higher in 2025.
Gold has a long history as a store of value and a means of exchange. Gold has rallied across all currency terms, including the U.S. dollar and all components of the dollar index. The bottom line is that gold’s ascent reflects the continued decline in other currencies’ purchasing power.
More U.S. rate cuts are on the horizon in 2026
The U.S. administration favors lower short-term rates and will likely appoint Fed officials in 2026 who will favor a more aggressive, dovish monetary policy approach. Therefore, the path of U.S. monetary policy favors further lower lows in the U.S. dollar index over the coming months.
Meanwhile, the growing number of trade deals over the recent weeks takes some pressure off inflationary concerns. Lower U.S. rates increase the odds of a falling dollar index.
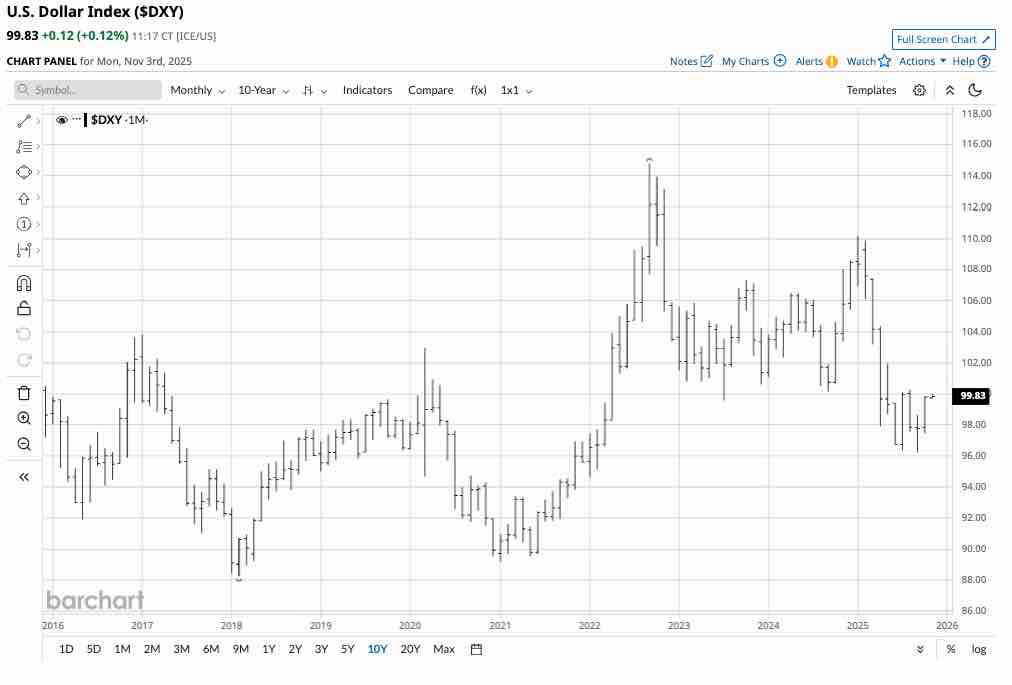
The monthly chart highlights that long-term technical support for the index is at the January 2021 low of 89.20 and the February 2018 low of 88.25. At the just under the 100 level, the dollar index has an over 10.6% downside potential before it reaches its first critical technical support level.
I rate the UDN ETF a buy
The Invesco DB U.S. Dollar Index Bearish -1X Fund (UDN) is an unleveraged ETF that appreciates as the dollar index declines.
At $18.44 per share, UDN had $151.126 million in assets under management. UDN trades an average of 130,298 shares daily and charges a management fee of 0.77%.
The dollar index declined 12.66% from its high in January 2025 to its low in September 2025.
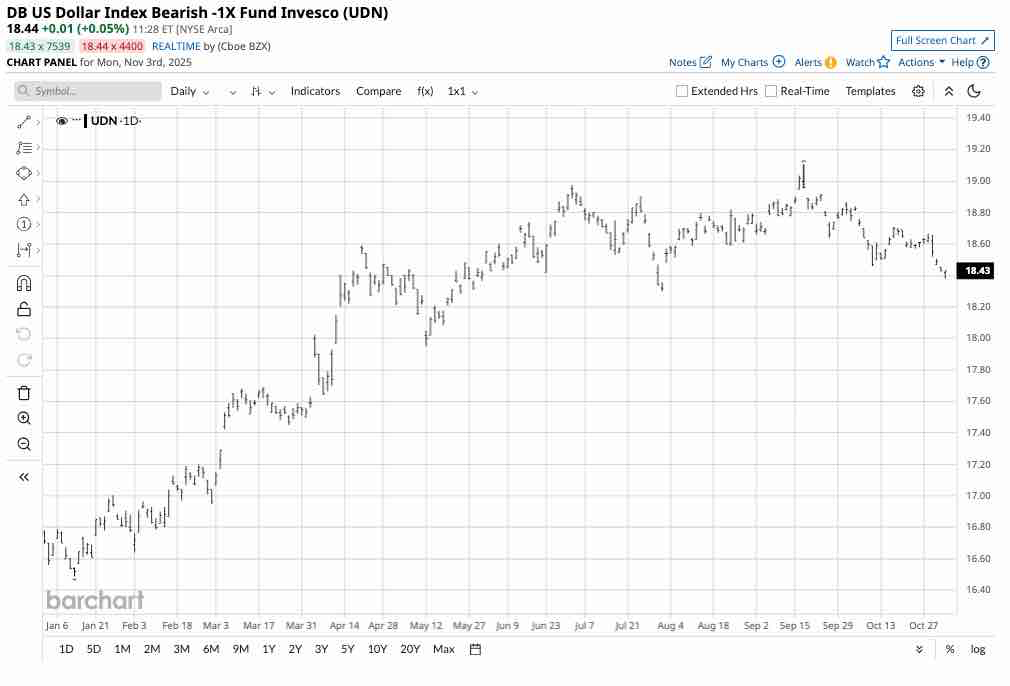
Over the same period, the UDN ETF moved 15.89% higher from $16.49 to $19.11 per share. The UDN ETF did an excellent job tracking the U.S. dollar index on the downside.
Lower U.S. interest rates, stable inflationary pressures, and the increasing number of trade deals could be bearish for the U.S. dollar in 2026. The administration will not necessarily pursue a strong-dollar policy, as a weaker U.S. currency makes U.S. exports more attractive in global markets. The dollar index could be heading toward a test of critical support below the 90 level, which is bullish for the UDN ETF product.
The dollar index is stuck in neutral in early November 2025, but it is consolidating near the low end of its recent trading range. The odds currently favor a continuation of the lower lows and lower highs and bearish trend in place since the high in early 2025.
On the date of publication, Andrew Hecht did not have (either directly or indirectly) positions in any of the securities mentioned in this article. All information and data in this article is solely for informational purposes. For more information please view the Barchart Disclosure Policy here.
More news from Barchart


