Volatility can be an option trader's best friend or worst enemy, depending on how it's approached.
High implied volatility percentile signals that options prices are elevated compared to their historical norms, creating unique opportunities for those who know how to capitalize on them.
Whether you're selling premium to take advantage of inflated option prices or seeking sharp price swings for directional trades, understanding which stocks have unusually high IV is crucial.
To get an accurate picture of stocks with a high implied volatility percentile, we can use the Stock Screener.
These elevated readings suggest the options market is pricing in significant potential price movements, whether due to upcoming earnings announcements, sector-specific developments, or broader market dynamics.
For traders considering volatility-based strategies, these stocks warrant particular attention as they may offer enhanced premium collection opportunities, though careful position sizing and risk management remain crucial.
Using The Stock Screener To Find High Volatility Stocks
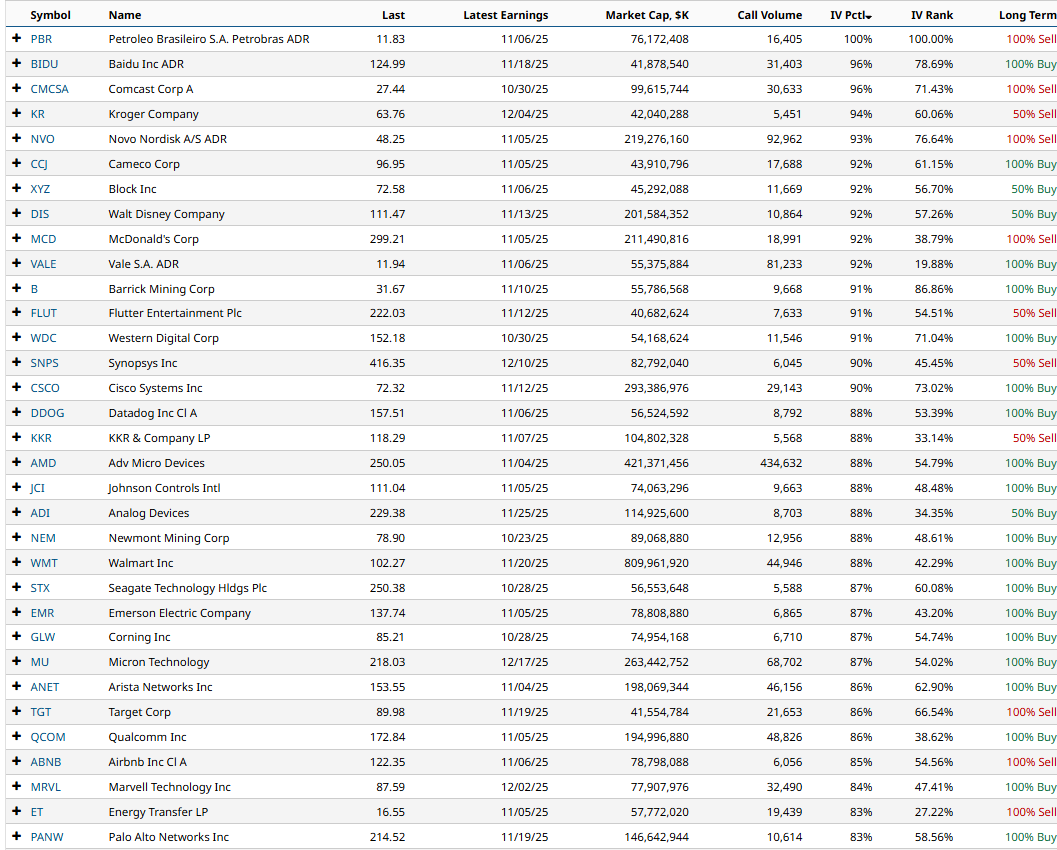
With volatility spiking in recent days, we have 18 stocks showing an IV percentile above 80.
We can set the following filters using the Stock Screener to find stocks with a high implied volatility percentile.
- Total Call Volume 5,000
- Market Cap greater than 40 billion
- IV Percentile greater than 80%
This screener gives us the following stocks ranked from highest IV Percentile to lowest:
Petroleo Brasileiro (PBR)
Baidu (BIDU)
Comcast (CMCSA)
Kroger Company (KR)
Novo Nordisk (NVO)
Cameco Corp (CCJ)
Block Inc (XYZ)
Walt Disney Company (DIS)
McDonald’s (MCD)
Vale S.A (VALE)
Here is the full list of stocks showing IV Percentile and earnings dates. In total there are 38 stocks that meet this scan criteria!


How To Use IV Percentile
Generally, when implied volatility percentile is high, focusing on short volatility trades such as iron condors, short straddles, and strangles is better.
It’s also a good idea to watch the upcoming earnings dates as stock can make big moves following earnings announcements.
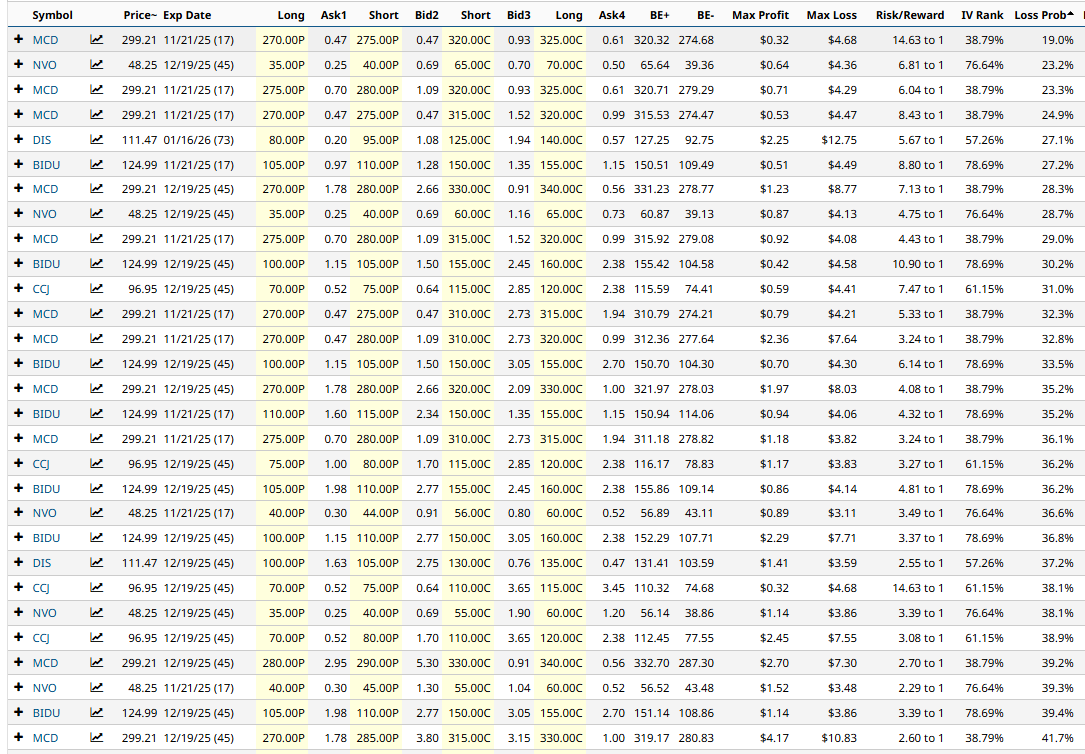
Iron Condor Screener
Let’s run an iron condor screener for the above stocks and analyze the results.

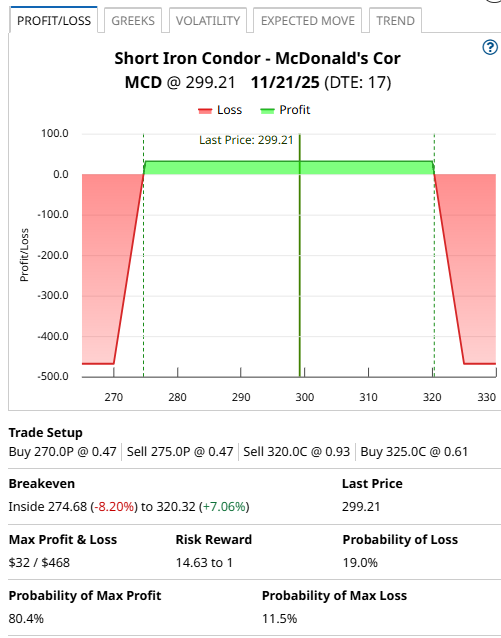
Let’s look at the first line item on McDonald’s.
Using the November 21 expiry, the trade would involve selling the $275 put and buying the $270 put. Then on the calls, selling the $320 call and buying the $325 call.
The price for the condor is $0.32 which means the trader would receive $32 into their account. The maximum risk is $468 for a Risk/Reward ratio of 16.63 to 1 with a Loss Probability of 19.0%.
The profit zone ranges between $274.68 and $320.32. This can be calculated by taking the short strikes and adding or subtracting the premium received.

Please remember that options are risky, and investors can lose 100% of their investment. This article is for education purposes only and not a trade recommendation. Remember to always do your own due diligence and consult your financial advisor before making any investment decisions.
On the date of publication, Gavin McMaster did not have (either directly or indirectly) positions in any of the securities mentioned in this article. All information and data in this article is solely for informational purposes. For more information please view the Barchart Disclosure Policy here.
More news from Barchart
- Volatility Alert: 10 Stocks Showing High IV Percentile
- You Can Now Bet on 4x Upside in S&P 500 Stocks with This ETF. Should You?
- Royal Caribbean’s (RCL) Options Implosion Offers Up a Massive Informational Arbitrage Trade
- Microsoft Produces Strong FCF As Expected - Shorting OTM Puts is an Attractive Play


