Dominion Energy, Inc. (D), based in Richmond, Virginia, operates a wide-ranging energy business that provides power and natural gas services to millions across multiple states. The company oversees extensive transmission and distribution networks, featuring a mix of fossil fuel, nuclear, hydroelectric, solar, and wind power plants, as well as modern gas pipelines and storage facilities.
Emphasizing innovative clean energy initiatives, Dominion Energy is known for ambitious renewable energy projects and a longstanding commitment to service reliability. The company has a market capitalization of $50.66 billion.
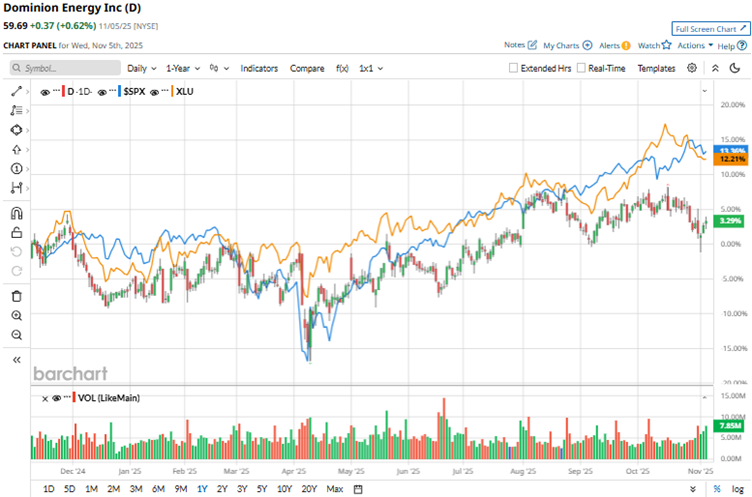
Facing regulatory uncertainties and cautious analyst sentiments, Dominion Energy’s stock price performance has been limited. Over the past 52 weeks, the stock has gained a modest 1.9%, while it is down 2.3% over the past three months. The shares had reached a 52-week high of $62.52 in October, but are down 4.5% from that level.
In contrast, the S&P 500 Index ($SPX) has gained 17.5% and 7.9% over the same periods, respectively, which reflects that the stock is underperforming the broader market. Dominion Energy’s business falls under the utilities sector. Comparing it with the Utilities Select Sector SPDR Fund (XLU), we see that the ETF is up 13.4% over the past 52 weeks and 2.9% over the past three months, outperforming Dominion Energy’s stock.
On Oct. 31, Dominion Energy reported its third-quarter results for fiscal 2025. The company’s operating revenues increased by 14.9% year-over-year (YOY) to $4.53 billion, which was higher than the $4.19 billion that Wall Street analysts had expected. Its operating earnings (on a non-GAAP basis) were $1.06 per share, higher than the expected $0.93 per share.
After reporting these gains, Dominion Energy narrowed its 2025 operating earnings guidance range to $3.33 to $3.48 per share, keeping the midpoint of the guidance range fixed at $3.40 per share. The company expects to meet or exceed the midpoint, given normal weather conditions. The company also reaffirmed its long-term operating EPS growth range of 5% to 7% through 2029.
For the fiscal year 2025, which ends in December 2025, Wall Street analysts expect Dominion Energy’s EPS to grow 22.7% YOY to $3.40 on a diluted basis. Moreover, EPS is expected to increase 5.6% annually to $3.59 in fiscal 2026. The company has a solid history of surpassing consensus estimates, topping them in all four trailing quarters.
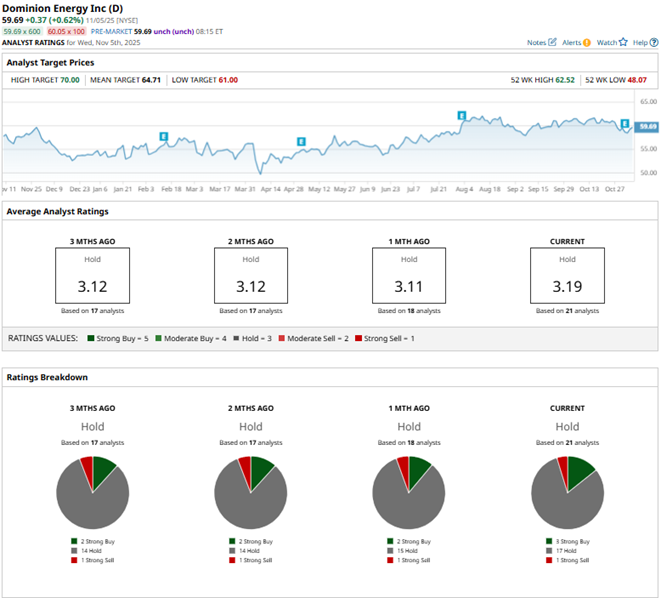
Among the 21 Wall Street analysts covering Dominion Energy’s stock, the consensus is a “Hold.” That’s based on three “Strong Buy” ratings, 17 “Holds,” and one “Strong Sell.” The ratings configuration is more bullish than it was a month ago, with three “Strong Buy” ratings now, up from two previously.
On Nov. 3, BMO Capital analyst James Thalacker maintained a “Market Perform” rating for Dominion Energy’s stock, while lowering the price target from $67 to $65. This shows a cautious stance that BMO Capital’s analysts are taking on the utilities firm.
Dominion Energy’s mean price target of $64.71 indicates an 8.4% upside over current market prices. The Street-high price target of $70 implies a potential upside of 17.3%.
On the date of publication, Anushka Mukherjee did not have (either directly or indirectly) positions in any of the securities mentioned in this article. All information and data in this article is solely for informational purposes. For more information please view the Barchart Disclosure Policy here.
More news from Barchart