Minneapolis, Minnesota-based General Mills, Inc. (GIS) is a global manufacturer and marketer of branded consumer foods. It operates through North America Retail, International, Pet, and North America Foodservice segments. With a market cap of nearly $24.7 billion, General Mills boasts an extensive portfolio of 100+ brands.
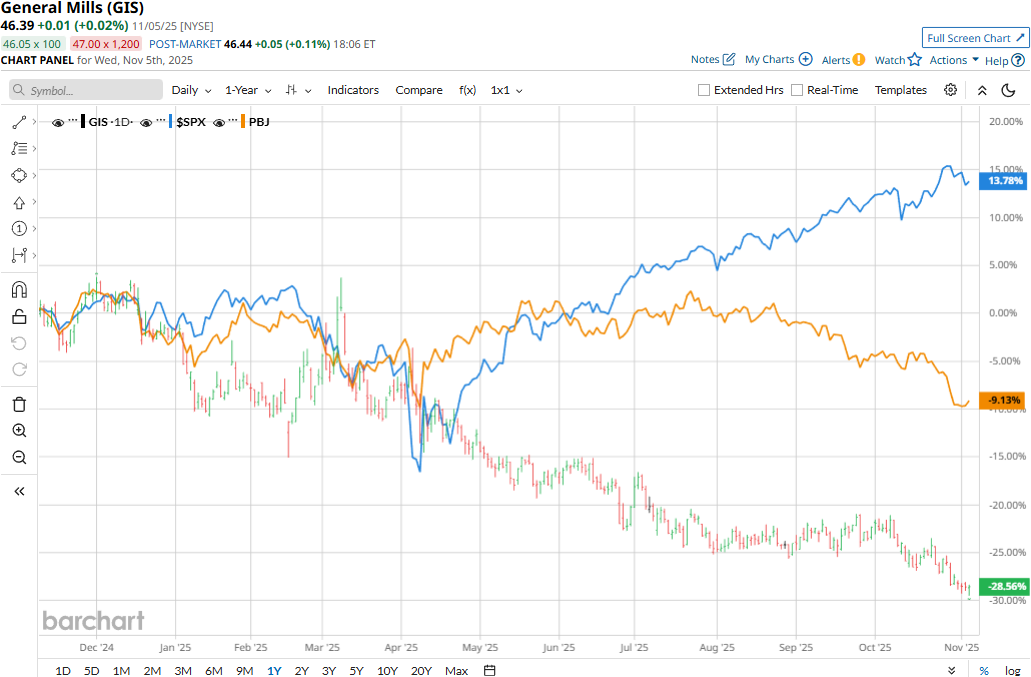
Despite its notable strengths, GIS has notably underperformed the broader market over the past year. The stock has plunged 27.3% on a YTD basis and tanked 32.1% over the past 52 weeks, notably lagging behind the S&P 500 Index’s ($SPX) 15.6% gains on a YTD basis and 17.5% returns over the past year.
Narrowing the focus, General Mills has also lagged behind the industry-focused Invesco Food & Beverage ETF’s (PBJ) 6.4% decline in 2025 and 8.4% dip over the past 52 weeks.
General Mills’ stock prices observed a marginal dip in the trading session following the release of its Q2 results on Sept. 17. The company has continued to face pressure on its topline; its net sales for the quarter dropped 7% year-over-year to $4.5 billion. This included a 4% decline due to the net impact of divestitures and acquisitions and a 3% drop in organic net sales due to unfavorable pricing. Nonetheless, the topline figure surpassed the Street’s expectations by 42 bps. Excluding the impact of gains from divestitures and other non-recurring items, General Mills’ margins have continued to suffer. Its adjusted EPS for the quarter dropped 19.6% year-over-year to $0.86, but surpassed the consensus estimates by 6.2%.
For the full fiscal 2026, ending in May, analysts expect GIS to deliver an adjusted EPS of $3.65, down 13.3% year-over-year. On a positive note, the company has a robust earnings surprise history. It has surpassed the Street’s bottom-line expectations in each of the past four quarters.
Among the 20 analysts covering the GIS stock, the consensus rating is a “Hold.” That’s based on four “Strong Buys,” one “Moderate Buy,” 12 “Holds,” and three “Strong Sells.”
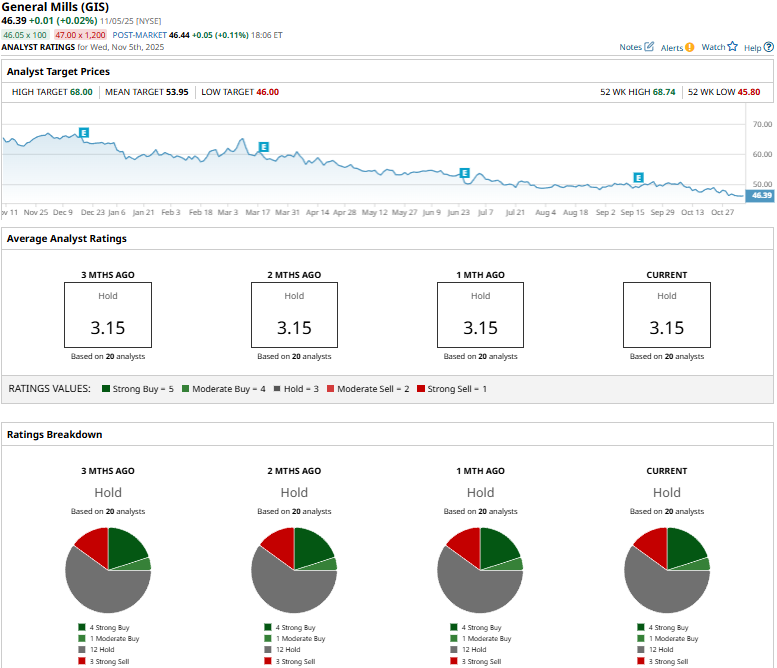
This configuration has remained stable in recent months.
On Sept. 19, Mizuho analyst John Baumgartner maintained a “Neutral” rating on GIS, but lowered the price target from $57 to $52.
General Mills’ mean price target of $53.95 suggests a 16.3% premium to current price levels. Meanwhile, its street-high target of $68 indicates a 46.6% upside potential.
On the date of publication, Aditya Sarawgi did not have (either directly or indirectly) positions in any of the securities mentioned in this article. All information and data in this article is solely for informational purposes. For more information please view the Barchart Disclosure Policy here.
More news from Barchart
- AbbVie Just Raised Its Dividend by 5.5%. Should You Buy ABBV Stock Here?
- 1 High-Risk, High-Reward Way to Trade Earnings with 0DTE Options
- Is This ‘Strong Buy’ Aerospace Stock a Giant Steal in 2025?
- Alex Karp Says ‘We Were Right, You Were Wrong’ as Palantir Delivers Record Revenue. Should You Buy PLTR Stock Here?