ETFOptimize | High-performance ETF-based Investment Strategies

Quantitative strategies, Wall Street-caliber research, and insightful market analysis since 1998.


ETFOptimize | HOME
Close Window

Is Wall Street Bullish or Bearish on Citizens Financial Stock?

Providence, Rhode Island-based Citizens Financial Group, Inc. (CFG) provides retail and commercial banking products and services. Valued at $22.1 billion by market cap, CFG offers consumer and commercial loans, mortgage finance, deposit products, retail and commercial banking, asset management, and trust services.

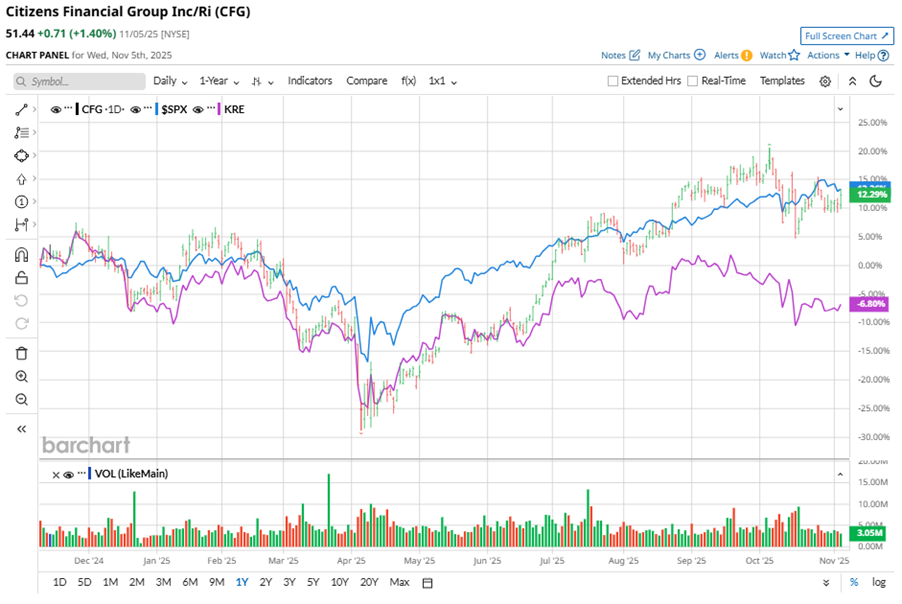
Shares of this bank holding company have outperformed the broader market over the past year. CFG has gained 21.8% over this time frame, while the broader S&P 500 Index ($SPX) has rallied nearly 17.5%. In 2025, CFG stock is up 17.6%, surpassing the SPX’s 15.6% rise on a YTD basis.


Zooming in further, CFG’s outperformance looks more pronounced compared to the SPDR S&P Regional Banking ETF (KRE). The exchange-traded fund has gained about 2.4% over the past year. Moreover, CFG’s double-digit gains on a YTD basis outshine the ETF’s marginal returns over the same time frame.

www.barchart.com

CFG's outperformance is driven by strong growth in its private bank and wealth franchise, with 3.5% NII growth and record capital markets performance. The private bank surpassed $12.5 billion in deposits, and capital markets delivered the second-highest quarterly results. Disciplined expense management and favorable credit trends also contributed to the strong performance.

On Oct. 15, CFG reported its Q3 results, and its shares closed down more than 6% in the following trading session. Its adjusted EPS of $1.05 beat Wall Street expectations of $1.02. The company’s revenue was $2.12 billion, topping Wall Street forecasts of $2.10 billion.

For the current fiscal year, ending in December, analysts expect CFG’s EPS to grow 18.5% to $3.84 on a diluted basis. The company’s earnings surprise history is impressive. It beat the consensus estimate in each of the last four quarters.

Among the 24 analysts covering CFG stock, the consensus is a “Strong Buy.” That’s based on 18 “Strong Buy” ratings, two “Moderate Buys,” and four “Holds.”

www.barchart.com

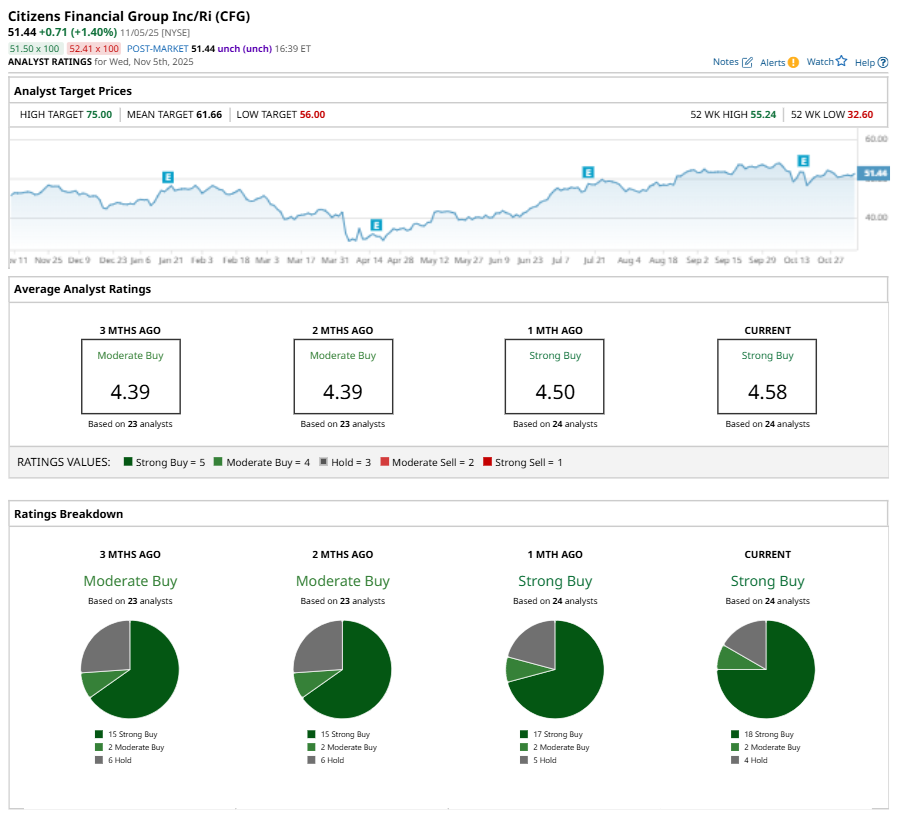
This configuration is more bullish than a month ago, with 17 analysts suggesting a “Strong Buy.”

On Nov. 5, Barclays PLC (BCS) analyst Jason Goldberg maintained a “Hold” rating on CFG and set a price target of $56, implying a potential upside of 8.9% from current levels.

The mean price target of $61.66 represents a 19.9% premium to CFG’s current price levels. The Street-high price target of $75 suggests an ambitious upside potential of 45.8%. 


On the date of publication, Neha Panjwani did not have (either directly or indirectly) positions in any of the securities mentioned in this article. All information and data in this article is solely for informational purposes. For more information please view the Barchart Disclosure Policy here.


More news from Barchart

Recent Quotes

View More
Symbol Price Change (%)
AMZN  220.69
+3.55 (1.63%)
AAPL  271.49
+5.24 (1.97%)
AMD  203.78
-2.24 (-1.09%)
BAC  51.56
+0.56 (1.10%)
GOOG  299.65
+9.67 (3.33%)
META  594.25
+5.10 (0.87%)
MSFT  472.12
-6.31 (-1.32%)
NVDA  178.88
-1.76 (-0.97%)
ORCL  198.76
-11.93 (-5.66%)
TSLA  391.09
-4.14 (-1.05%)
Stock Quote API & Stock News API supplied by www.cloudquote.io
Quotes delayed at least 20 minutes.
By accessing this page, you agree to the Privacy Policy and Terms Of Service.


IntelligentValue Home
Close Window

DISCLAIMER

All content herein is issued solely for informational purposes and is not to be construed as an offer to sell or the solicitation of an offer to buy, nor should it be interpreted as a recommendation to buy, hold or sell (short or otherwise) any security.  All opinions, analyses, and information included herein are based on sources believed to be reliable, but no representation or warranty of any kind, expressed or implied, is made including but not limited to any representation or warranty concerning accuracy, completeness, correctness, timeliness or appropriateness. We undertake no obligation to update such opinions, analysis or information. You should independently verify all information contained on this website. Some information is based on analysis of past performance or hypothetical performance results, which have inherent limitations. We make no representation that any particular equity or strategy will or is likely to achieve profits or losses similar to those shown. Shareholders, employees, writers, contractors, and affiliates associated with ETFOptimize.com may have ownership positions in the securities that are mentioned. If you are not sure if ETFs, algorithmic investing, or a particular investment is right for you, you are urged to consult with a Registered Investment Advisor (RIA). Neither this website nor anyone associated with producing its content are Registered Investment Advisors, and no attempt is made herein to substitute for personalized, professional investment advice. Neither ETFOptimize.com, Global Alpha Investments, Inc., nor its employees, service providers, associates, or affiliates are responsible for any investment losses you may incur as a result of using the information provided herein. Remember that past investment returns may not be indicative of future returns.

Copyright © 1998-2017 ETFOptimize.com, a publication of Optimized Investments, Inc. All rights reserved.