New York-based American Express Company (AXP) is an integrated payments company, famously known for its premium credit card offerings. It operates through the U.S. Consumer Services, Commercial Services, International Card Services, and Global Merchant and Network Services segments. With a market cap of $252 billion, its operations span the Americas, the Indo-Pacific, and EMEA.
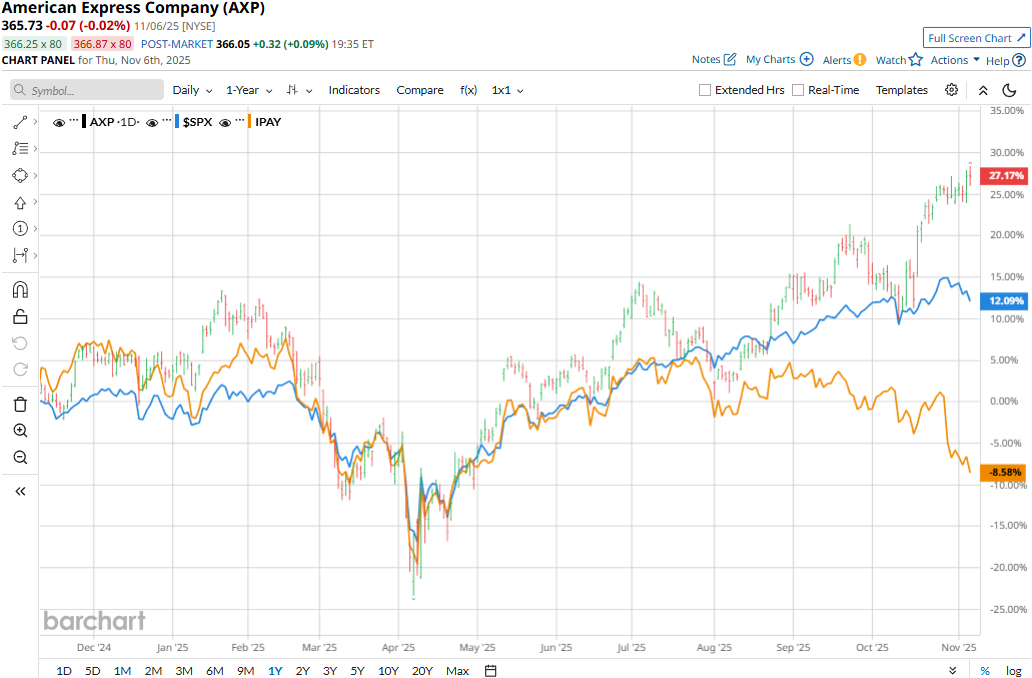
The credit card giant has continued to outperform the broader market over the past year. AXP stock prices have surged 23.2% on a YTD basis and 23.9% over the past 52 weeks, notably outpacing the S&P 500 Index’s ($SPX) 14.3% gains in 2025 and 13.4% returns over the past year.
Narrowing the focus, AXP has also outpaced the industry-focused Amplify Digital Payments ETF’s (IPAY) 9.1% decline on a YTD basis and 7.8% dip over the past year.
American Express’ stock prices soared 7.3% in a single trading session following the release of its Q3 results on Oct. 17. While continuing to maintain its best-in-class credit metrics, the company also observed an 8% organic growth in card spending, helping the company report record quarterly revenues. Further, the demand for its U.S. Consumer and Business Platinum Cards surpassed expectations, reinforcing its leadership in the premium credit cards segment.
Its topline for the quarter increased 11% year-over-year to $18.4 billion, surpassing the Street’s expectations by 2.4%. Its adjusted EPS soared 18.6% year-over-year to $4.14, beating the consensus estimates by 4.6%. Observing the solid momentum, American Express raised its full-year earnings and topline guidance, which boosted investor confidence.
For the full fiscal 2025, ending in December, analysts expect AXP to deliver an adjusted EPS of $15.43, up 15.6% year-over-year. Moreover, the company has a robust earnings surprise history. It has surpassed the Street’s bottom-line estimates in each of the past four quarters.
Among the 30 analysts covering the AXP stock, the consensus rating is a “Moderate Buy.” That’s based on eight “Strong Buys,” two “Moderate Buys,” 19 “Holds,” and one “Strong Sell.”
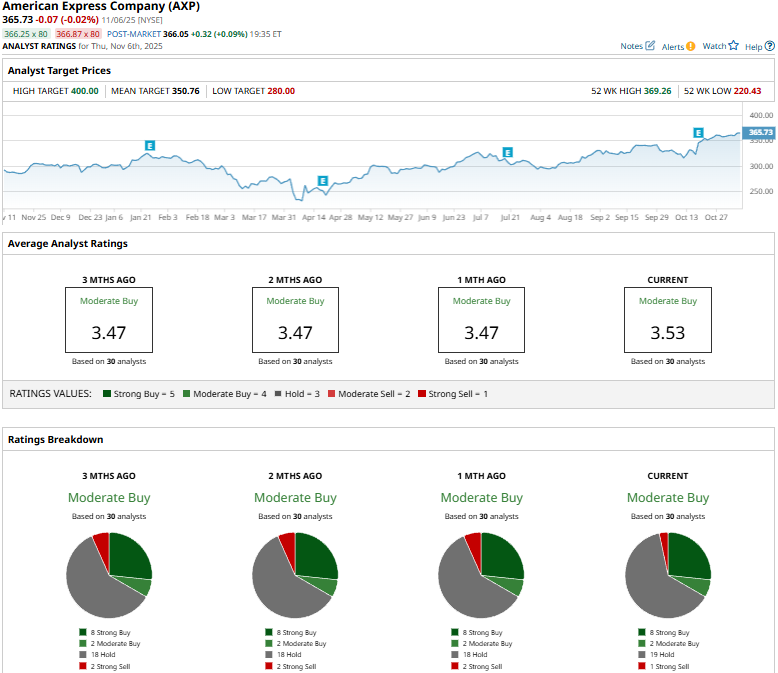
This configuration is slightly more optimistic than a month ago, when two analysts gave “Strong Sell” recommendations.
On Oct. 25, Freedom Capital Markets analyst Mikhail Paramonov upgraded AXP from “Sell” to “Hold” and raised the price target from $280 to $325.
As of writing, AXP is trading above its mean price target of $350.76. Meanwhile, the street-high target of $400 suggests a 9.4% upside potential from current price levels.
On the date of publication, Aditya Sarawgi did not have (either directly or indirectly) positions in any of the securities mentioned in this article. All information and data in this article is solely for informational purposes. For more information please view the Barchart Disclosure Policy here.
More news from Barchart
- Verizon Is Getting an Amazon Data Center Boost. Should You Buy the High-Yield Dividend Stock Here?
- ServiceNow Just Announced a 5-for-1 Stock Split. So, Is Now the Time to Buy NOW Stock?
- Palantir Is Getting a Bigger Seat at the Defense Table. Does That Make PLTR Stock a Buy Here?
- Analysts Say ‘We Would Be Aggressive Buyers on Any Pullbacks’ in Microsoft Stock. Should You Be Too?