Valued at a market cap of $47.6 billion, Xcel Energy Inc. (XEL) is a leading U.S. electric and natural gas utility company based in Minneapolis, Minnesota. It is known for its strong commitment to the clean energy transition, operating a diversified generation portfolio that includes wind, solar, hydro, nuclear, and natural gas assets.
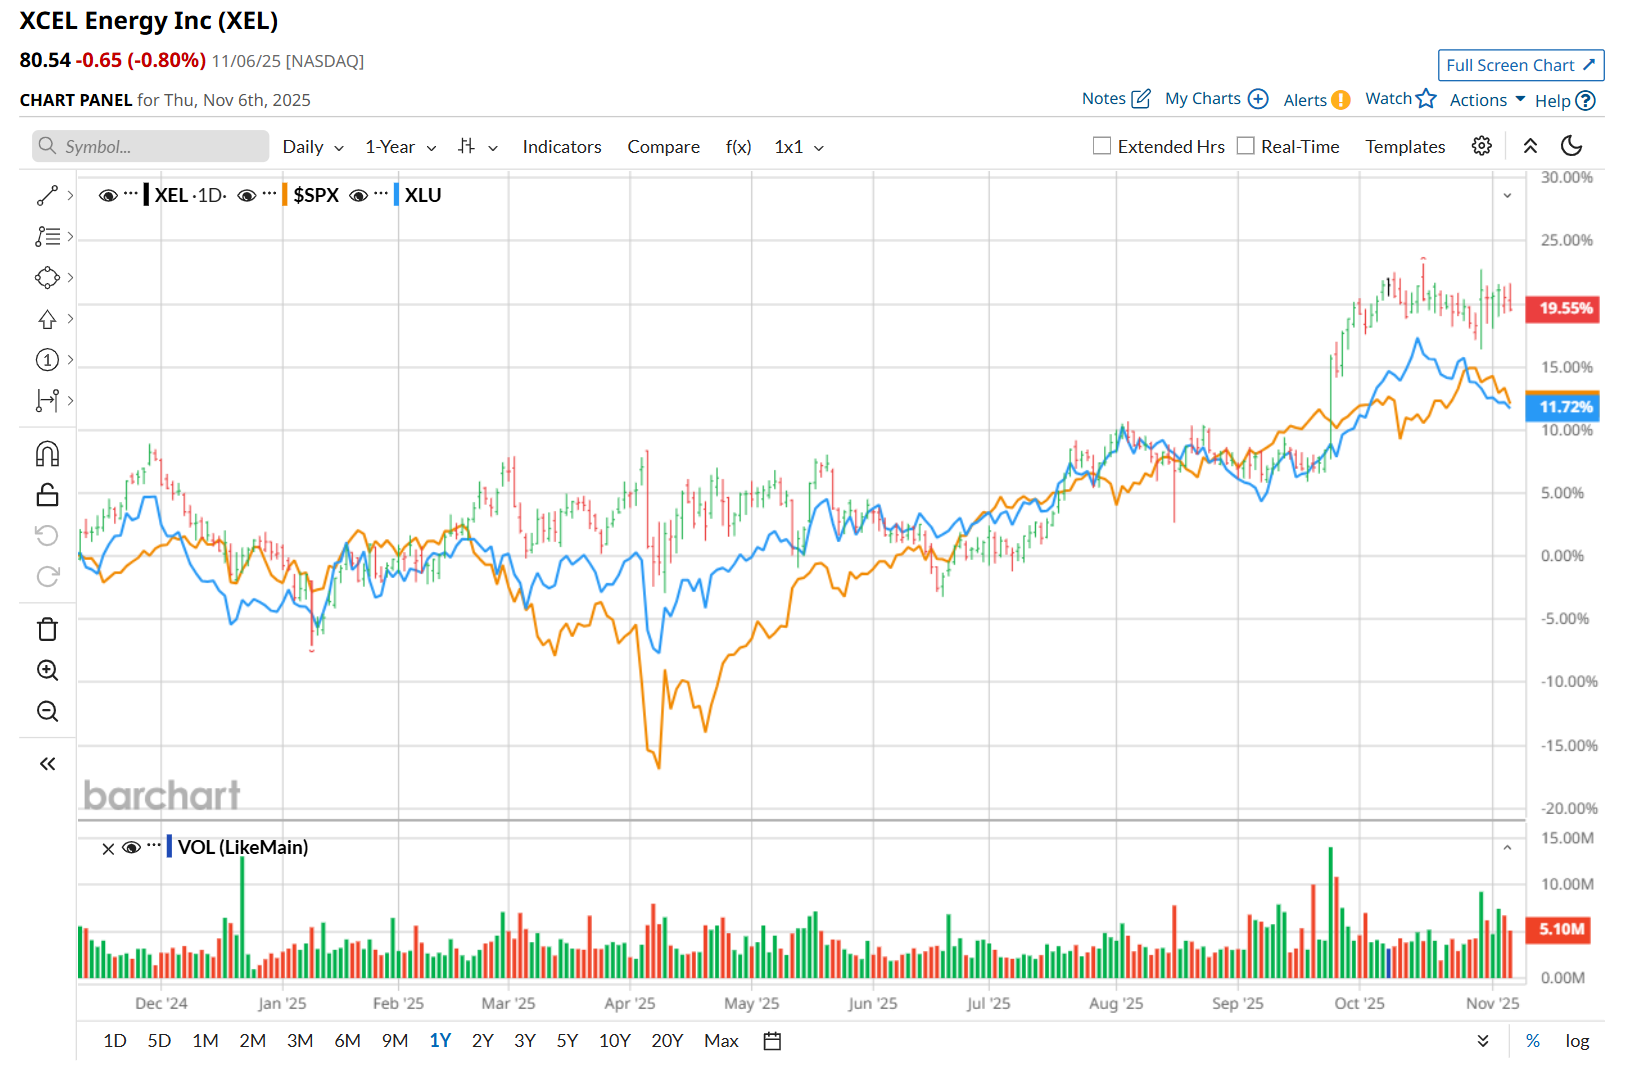
This utility company has outperformed the broader market over the past 52 weeks. Shares of XEL have rallied 21.1% over this time frame, while the broader S&P 500 Index ($SPX) has gained 13.4%. Moreover, on a YTD basis, the stock is up 19.3%, compared to SPX’s 14.3% return.
Zooming in further, XEL has also outpaced the Utilities Select Sector SPDR Fund’s (XLU) 14.1% uptick over the past 52 weeks and 16.9% YTD rise.
On Oct. 30, shares of XEL rose 2.4% after its Q3 earnings release, despite posting a weaker-than-expected performance. Both its operating revenue of $3.9 billion and adjusted EPS of $1.24 fell short of the consensus estimates. Meanwhile, due to higher electric and natural gas revenues, its top line improved 7.4% from the year-ago quarter. On the other hand, its bottom line declined marginally from the same period last year, fueled by a rise in interest charges and O&M expenses.
For the current fiscal year, ending in December, analysts expect XEL’s EPS to grow 8.9% year over year to $3.81. The company’s earnings surprise history is disappointing. It missed the consensus estimates in three of the last four quarters, while surpassing on another occasion.
Among the 19 analysts covering the stock, the consensus rating is a "Strong Buy,” which is based on 14 “Strong Buy,” one “Moderate Buy,” and four "Hold.”
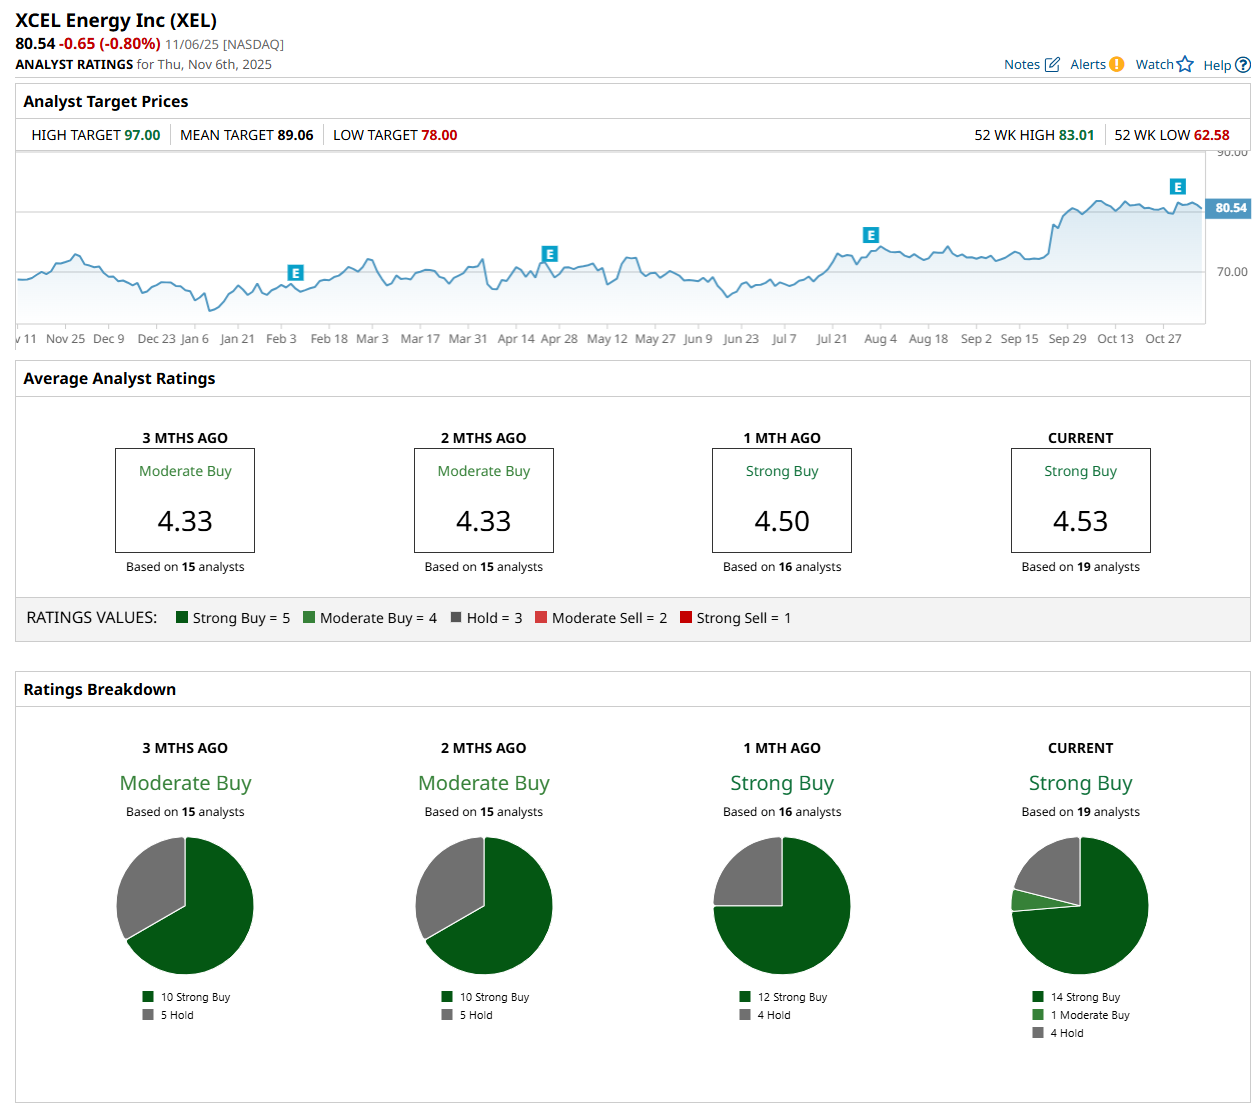
This configuration is more bullish than a month ago, with 12 analysts suggesting a “Strong Buy” rating.
On Nov. 5, Barclays PLC (BCS) maintained an "Overweight" rating on XEL and raised its price target to $85, indicating a 5.5% potential upside from the current levels.
The mean price target of $89.06 represents a 10.6% premium from XEL’s current price levels, while the Street-high price target of $97 suggests an upside potential of 20.4%.
On the date of publication, Neharika Jain did not have (either directly or indirectly) positions in any of the securities mentioned in this article. All information and data in this article is solely for informational purposes. For more information please view the Barchart Disclosure Policy here.
More news from Barchart
- Nvidia Stock 2026 Prediction: Can NVDA’s Gravity-Defying Rally Continue?
- These 3 Tech Stocks Have Been Red-Hot in 2025 but Their Charts Are Screaming ‘Danger’
- Stock Index Futures Slip as Valuation and Economic Concerns Persist, U.S. Confidence Data on Tap
- Verizon Is Getting an Amazon Data Center Boost. Should You Buy the High-Yield Dividend Stock Here?


