Headquartered in St. Louis, Missouri, Ameren Corporation (AEE) provides comprehensive utility services to Missouri and Illinois. The company’s operations center on generating, transmitting, and distributing energy, with a focus on advanced power infrastructure and grid improvements for reliability and sustainability.
Multi-state operations and ongoing investments in renewable resources position Ameren as a leading regional energy provider, dedicated to providing safe and modern utility solutions. The company has a market capitalization of $27.39 billion.
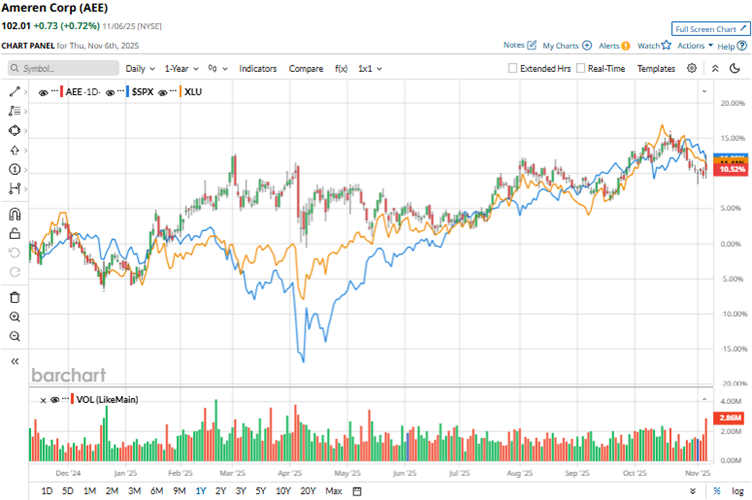
Ameren’s stock has been holding steady due to its solid fundamentals. Over the past 52 weeks, the stock has gained 16.2%, with a marginal increase over the past three months. It had reached a 52-week high of $106.73 in October, but is now down 4.4% from that level.
In contrast, the S&P 500 Index ($SPX) has gained 13.4% and 5.9% over the same periods, respectively, indicating that the stock has outperformed the broader market over the past year but underperformed over the past six months. Ameren’s business falls under the utilities sector. Comparing it with the Utilities Select Sector SPDR Fund (XLU), we see that the ETF is up 14.1% over the past 52 weeks and 3.3% over the past three months, reflecting the same trend as with the broader market.
On Nov. 5, Ameren reported its third-quarter results for fiscal 2025. The company’s total operating revenues increased 24.2% year-over-year (YOY) to $2.70 billion, exceeding the analyst-expected figure of $2.41 billion. This was predicated upon electric revenues increasing 25.9% annually to $2.56 billion. Its adjusted EPS climbed 16% YOY to $2.17, surpassing the consensus estimate of $2.10.
The company’s earnings growth was based on expanded investments in infrastructure, the new electric service rate for Ameren Missouri, which took effect on June 1, and a warm July, which led to higher retail sales.
Based on the financial growth, Ameren raised its guidance for fiscal 2025. The company’s GAAP EPS is projected to be in the range of $5.08 to $5.28, while adjusted EPS is forecasted to be in the range of $4.90 to $5.10. Both guidance ranges are an improvement from the previous guidance range of $4.85 to $5.05.
For the fiscal year 2025, which ends in December 2025, Wall Street analysts expect Ameren’s EPS to grow 7.6% YOY to $4.98 on a diluted basis. Moreover, EPS is expected to increase 7% annually to $5.33 in fiscal 2026. The company has a mixed history of surpassing consensus estimates, topping them in two of the four trailing quarters, and missing them in the other two instances.
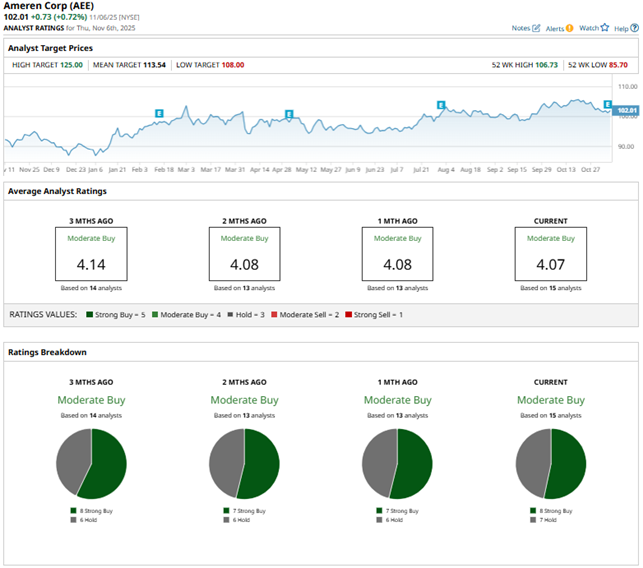
Among the 15 Wall Street analysts covering Ameren’s stock, the consensus is a “Moderate Buy.” That’s based on eight “Strong Buy” ratings and seven “Holds.” The ratings configuration has remained the same over the past month, with the addition of one “Strong Buy” and one “Hold” rating.
Last month, analysts at Wells Fargo initiated coverage on the stock with an “Overweight” rating and a $112 price target. Wells Fargo started coverage of a group of utilities firms that are actually growing earnings and trading at a valuation that does not precisely reflect their robust fundamentals.
Ameren’s mean price target of $113.54 indicates an 11.3% upside over current market prices. The Street-high price target of $125 implies a potential upside of 22.5%.
On the date of publication, Anushka Mukherjee did not have (either directly or indirectly) positions in any of the securities mentioned in this article. All information and data in this article is solely for informational purposes. For more information please view the Barchart Disclosure Policy here.
More news from Barchart