Chicago-based Archer-Daniels-Midland Company (ADM) engages in the procurement, transportation, storage, processing, and merchandising of agricultural commodities, ingredients, and flavors. With a market cap of $27 billion, the company’s operations span the Americas, Europe, and internationally.
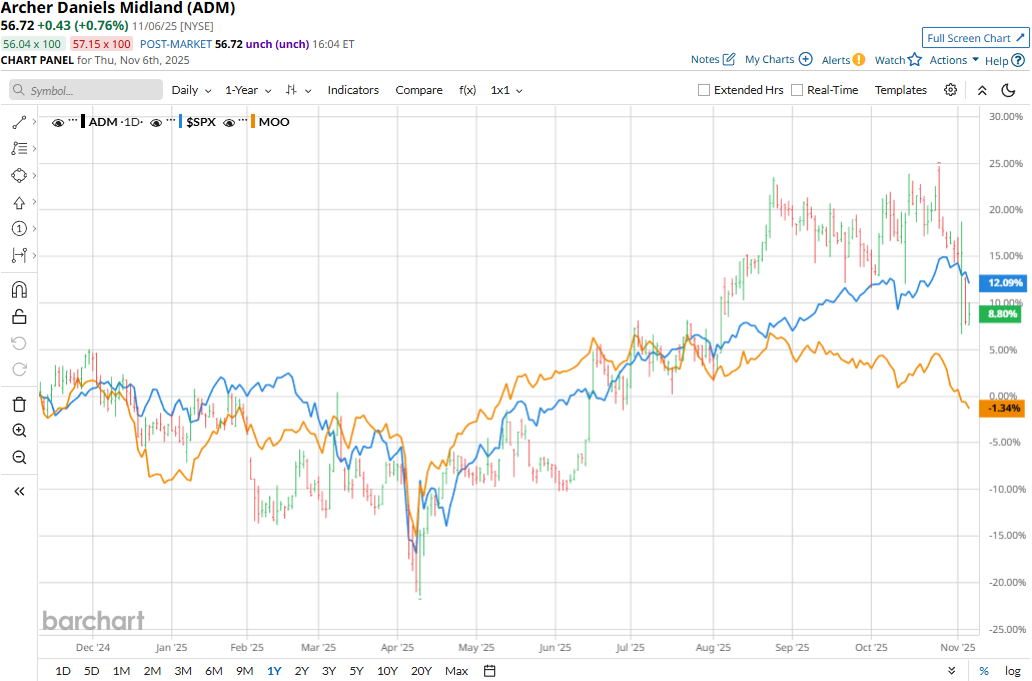
The agriculture major has notably underperformed the broader market over the past year. ADM stock prices have surged 12.3% on a YTD basis and gained 6.5% over the past 52 weeks, compared to the S&P 500 Index’s ($SPX) 14.3% gains in 2025 and 13.4% returns over the past year.
However, the stock has notably outpaced the industry-focused Vaneck Agribusiness ETF’s (MOO) 8.4% uptick on a YTD basis and 2.2% decline over the past 52 weeks.
Archer-Daniels-Midland’s stock prices remained mostly flat in the trading session following the release of its mixed Q3 results on Nov. 4. The company successfully navigated the soft and challenging macro environment and made notable progress on portfolio optimization initiatives and cost savings. Its topline for the quarter inched up 2.2% year-over-year- to $20.4 billion, but missed the Street’s expectations by 1.4%. Meanwhile, its adjusted EPS dipped from $1.09 to $0.92, but surpassed the consensus estimates by 3.4%.
On a concerning note, the company reduced its full-year EPS guidance from the previous $4.00 projection to the range of $3.25 - $3.50. Further, in the subsequent trading session, Archer-Daniels-Midland’s share prices plunged 6.4% after its stock was downgraded by JP Morgan.
For the full fiscal 2025, ending in December, analysts expect ADM to deliver an adjusted EPS of $3.45, down 27.2% year-over-year. The company has a robust earnings surprise history. It has surpassed the Street’s bottom-line estimates in each of the past four quarters.
Among the 11 analysts covering the ADM stock, the consensus rating is a “Hold.” That’s based on one “Strong Buy,” seven “Holds,” two “Moderate Sells,” and one “Strong Sell.”
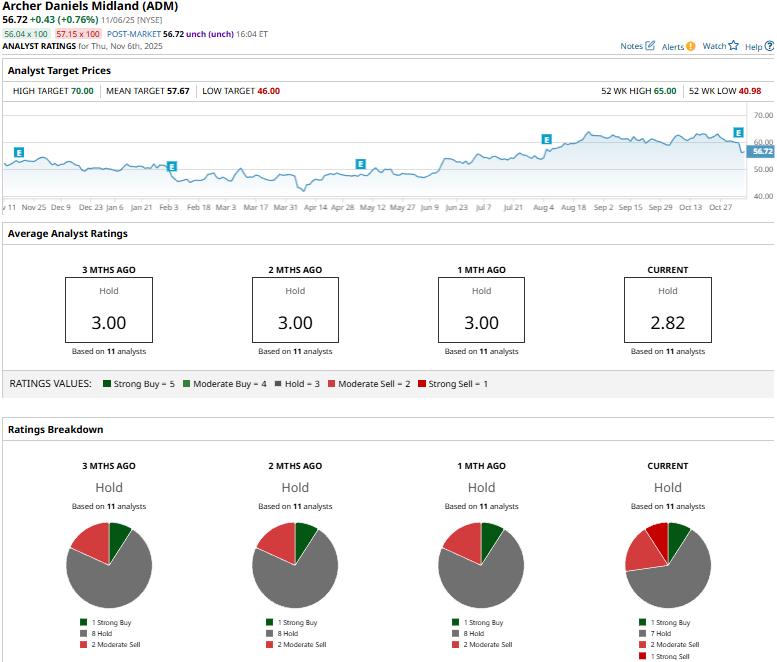
This configuration is slightly more pessimistic than a month ago, when none of the analysts covering ADM gave “Strong Sell” recommendations.
On Nov. 5, JP Morgan (JPM) analyst Thomas Palmer downgraded ADM from “Equal-Weight” to “Underweight” and reduced the price target from $61 to $59.
ADM’s mean price target of $57.67 represents a modest 1.7% premium to current price levels. Meanwhile, the street-high target of $70 suggests a 21.4% upside potential.
On the date of publication, Aditya Sarawgi did not have (either directly or indirectly) positions in any of the securities mentioned in this article. All information and data in this article is solely for informational purposes. For more information please view the Barchart Disclosure Policy here.
More news from Barchart
- Verizon Is Getting an Amazon Data Center Boost. Should You Buy the High-Yield Dividend Stock Here?
- ServiceNow Just Announced a 5-for-1 Stock Split. So, Is Now the Time to Buy NOW Stock?
- Palantir Is Getting a Bigger Seat at the Defense Table. Does That Make PLTR Stock a Buy Here?
- Analysts Say ‘We Would Be Aggressive Buyers on Any Pullbacks’ in Microsoft Stock. Should You Be Too?