Valued at a market cap of $19.2 billion, Trimble Inc. (TRMB) is a technology company that provides advanced positioning, modeling, and data analytics solutions. The Westminster, Colorado-based company integrates technologies such as GPS, laser, optics, and software to improve productivity, accuracy, and safety across various industries, including construction, agriculture, transportation, and geospatial services.
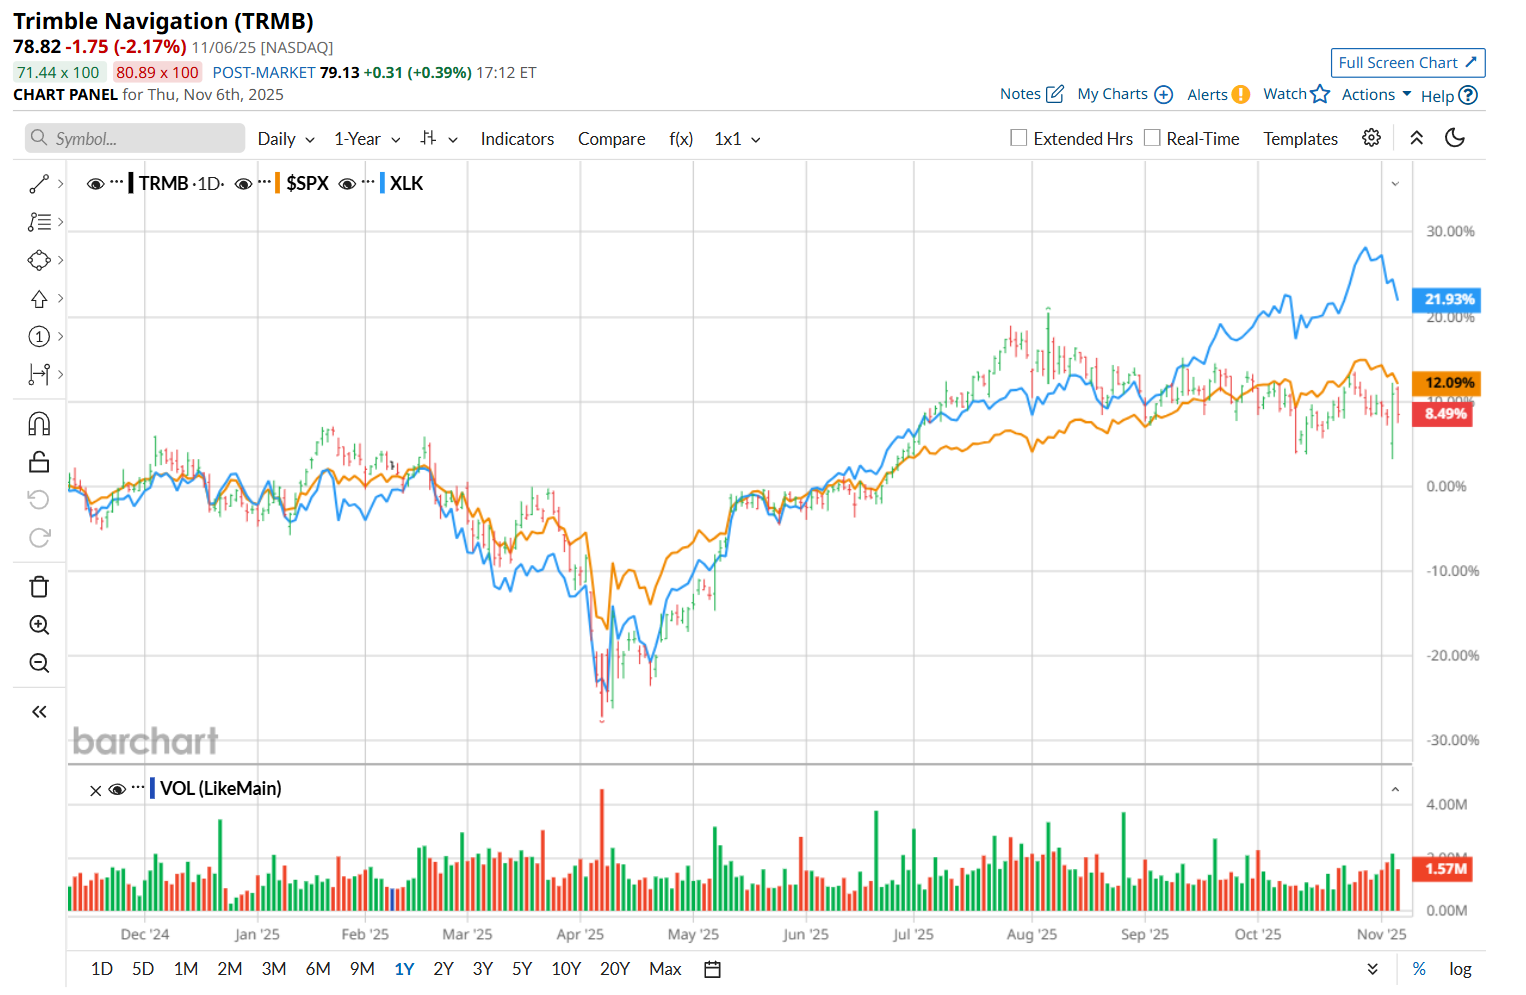
This tech company has underperformed the broader market over the past 52 weeks. Shares of Trimble have gained 8.5% over this time frame, while the broader S&P 500 Index ($SPX) has surged 13.4%. Moreover, on a YTD basis, the stock is up 11.6%, compared to SPX’s 14.3% return.
Narrowing the focus, Trimble has also lagged behind the Technology Select Sector SPDR Fund’s (XLK) 23.9% uptick over the past 52 weeks and 24.4% YTD rise.
Shares of Trimble rose 2.5% after reporting stronger-than-expected Q3 results on Nov. 5. The company achieved a record Q3 gross margin of 68.9% and annualized recurring revenue of $2.3 billion. Its total revenue improved 2.9% year-over-year to $901.2 million, surpassing consensus estimates by 3.4%. Meanwhile, its adjusted EPS came in at $0.81, up 15.7% from the year-ago quarter and 12.5% ahead of analyst expectations. Additionally, noting strong progress under its Connect & Scale strategy, TRMB raised its fiscal 2025 guidance, further bolstering investor confidence.
For the current fiscal year, ending in December, analysts expect TRMB’s EPS to grow 10.4% year over year to $2.44. The company’s earnings surprise history is mixed. It topped the consensus estimates in three of the last four quarters, while missing on another occasion.
Among the 13 analysts covering the stock, the consensus rating is a “Strong Buy,” which is based on nine “Strong Buy,” one “Moderate Buy,” and three "Hold” ratings.
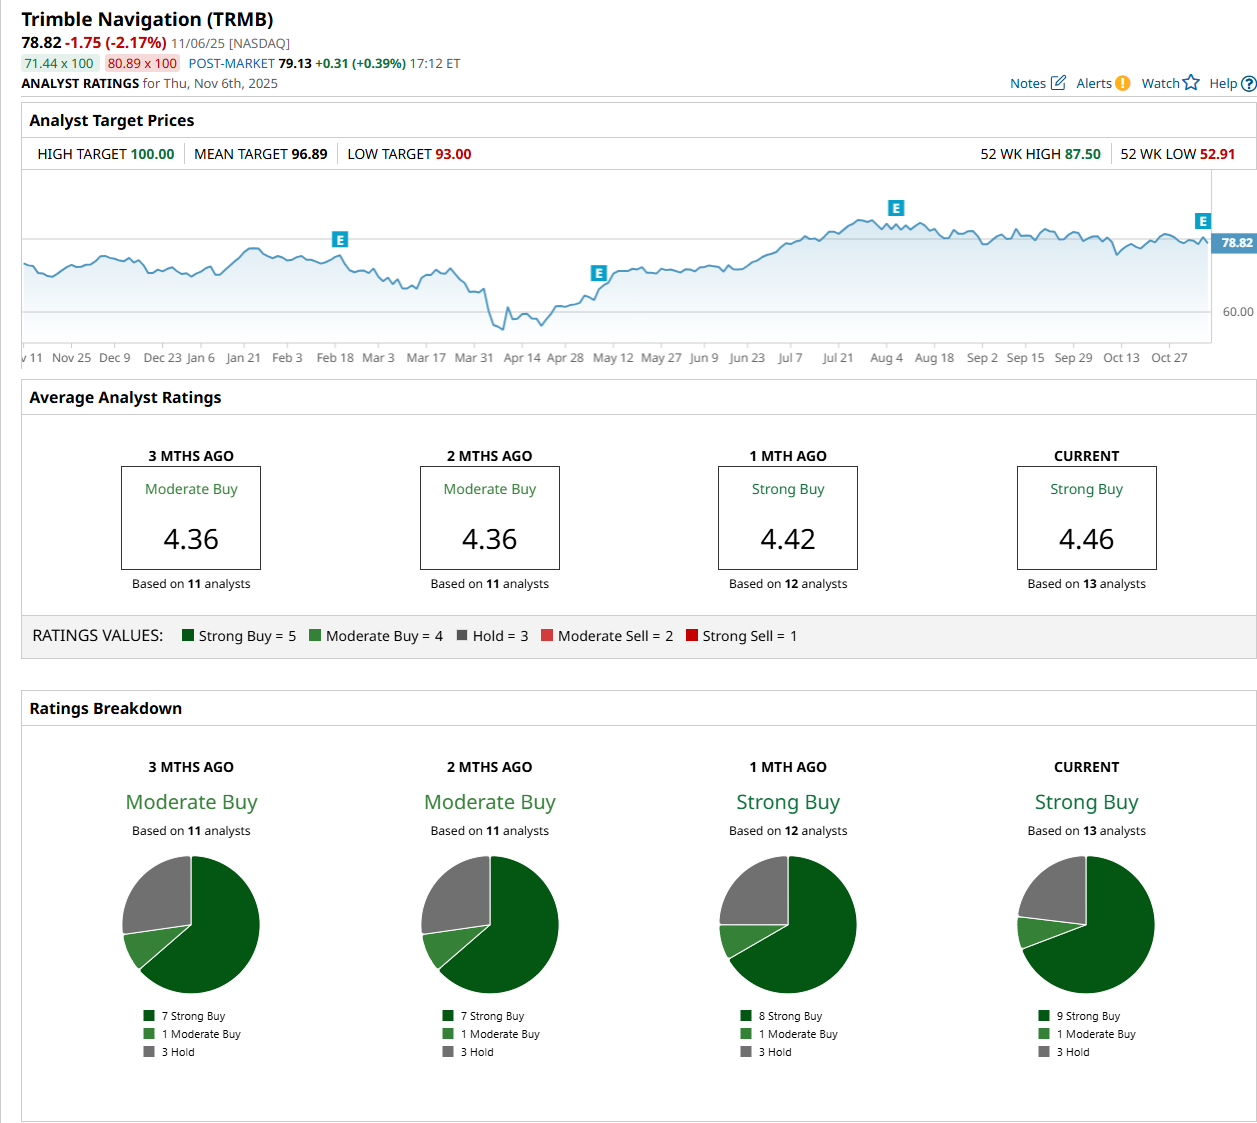
This configuration is slightly more bullish than a month ago, with eight analysts suggesting a “Strong Buy” rating.
On Nov. 6, Kristen Owen from Oppenheimer Holdings Inc. (OPY) maintained a “Buy" rating on TRMB, with a price target of $102, the Street-high price target, indicating a 29.4% potential upside from the current levels.
The mean price target of $96.89 represents a 22.9% premium from TRMB’s current price levels.
On the date of publication, Neharika Jain did not have (either directly or indirectly) positions in any of the securities mentioned in this article. All information and data in this article is solely for informational purposes. For more information please view the Barchart Disclosure Policy here.
More news from Barchart
- Verizon Is Getting an Amazon Data Center Boost. Should You Buy the High-Yield Dividend Stock Here?
- ServiceNow Just Announced a 5-for-1 Stock Split. So, Is Now the Time to Buy NOW Stock?
- Palantir Is Getting a Bigger Seat at the Defense Table. Does That Make PLTR Stock a Buy Here?
- Analysts Say ‘We Would Be Aggressive Buyers on Any Pullbacks’ in Microsoft Stock. Should You Be Too?


