- Intercorp Financial Services (IFS) is trading at a 5-year high and has strong technical momentum.
- Shares are up 63% in the past 52 weeks and nearly 50% in the year to date.
- IFS has a 100% “Buy” opinion from Barchart.
- Fundamentals remain solid for IFS, with projected revenue and earnings growth, a 2.29% dividend yield, and a reasonable valuation.
Today’s Featured Stock
Valued at $4.96 billion, Intercorp Financial Services (IFS) provides financial products and services. The company's business segments focus on banks, insurance, real estate, and other financial solutions. Intercorp Financial Services is based in Lima, Peru.
What I’m Watching
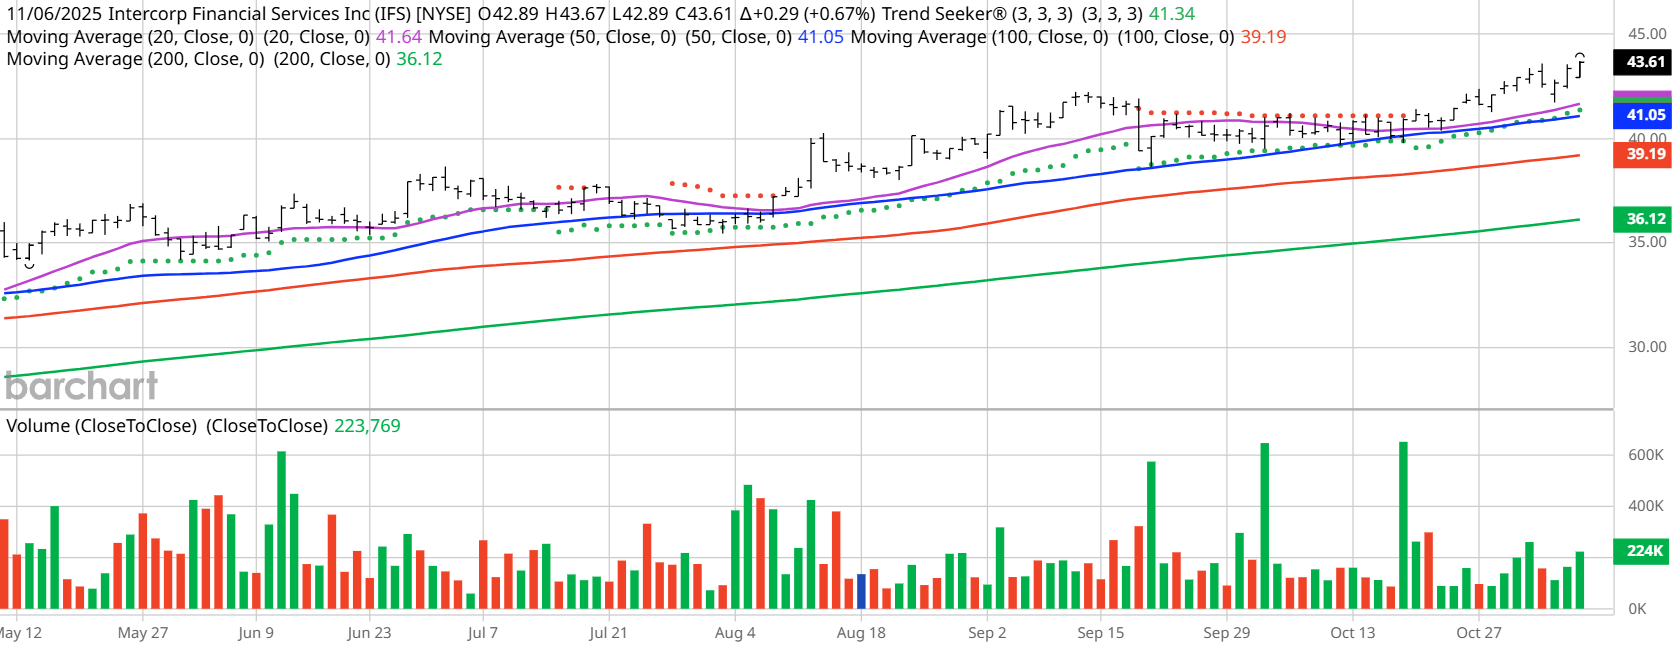
I found today’s Chart of the Day by using Barchart’s powerful screening functions to sort for stocks with the highest technical buy signals; superior current momentum in both strength and direction; and a Trend Seeker “buy” signal. I then used Barchart’s Flipcharts feature to review the charts for consistent price appreciation. IFS checks those boxes. Since the Trend Seeker signaled a new “Buy” on Oct. 20, the stock has gained 6.06%.
Barchart Technical Indicators for Intercorp Financial Services
Editor’s Note: The technical indicators below are updated live during the session every 20 minutes and can therefore change each day as the market fluctuates. The indicator numbers shown below therefore may not match what you see live on the Barchart.com website when you read this report. These technical indicators form the Barchart Opinion on a particular stock.
Intercorp hit a 5-year high of $43.67 in intraday trading on Nov. 6.
- IFS has a Weighted Alpha of +61.77.
- Intercorp has a 100% “Buy” opinion from Barchart.
- The stock gained 63.33% over the past year.
- IFS has its Trend Seeker “Buy” signal intact.
- The stock recently traded at $43.61 with a 50-day moving average of $41.05.
- Intercorp has made 12 new highs and gained 8.03% in the last month.
- Relative Strength Index (RSI) is at 68.86.
- There’s a technical support level around $43.11.
Don’t Forget the Fundamentals
- $4.96 billion market capitalization.
- 9.47x trailing price-earnings ratio.
- 2.29% dividend yield.
- Revenue is projected to grow 1.78% this year and another 8.80% next year.
- Earnings are estimated to increase 12.41% this year and an additional 17.91% next year.
Analyst and Investor Sentiment on Intercorp Financial Services
I don’t buy stocks because everyone else is buying, but I do realize that if major firms and investors are dumping stock, it’s hard to make money swimming against the tide.
It looks like Wall Street analysts like IFS.
- The Wall Street analysts tracked by Barchart have issued 3 “Strong Buys” and 1 “Hold” opinion on the stock with price targets between $39 and $51.
- Value Line does not rate foreign stocks
- CFRA’s MarketScope Advisor rates it a “Strong Buy.”
- 1,430 investors monitor the stock on Seeking Alpha, which rates the stock a “Hold.”
The Bottom Line on Intercorp Financial Services
Wall Street analysts seem to be bullish. A comment on Seeking Alpha sums it up: “The company benefits from a favorable macroeconomic environment in Peru, with projected GDP growth and stable inflation, supporting IFS’s growth outlook and shareholder returns through dividends and potential buybacks.”
Today’s Chart of the Day was written by Jim Van Meerten. Read previous editions of the daily newsletter here.
Additional disclosure: The Barchart of the Day highlights stocks that are experiencing exceptional current price appreciation. They are not intended to be buy recommendations as these stocks are extremely volatile and speculative. Should you decide to add one of these stocks to your investment portfolio it is highly suggested you follow a predetermined diversification and moving stop loss discipline that is consistent with your personal investment risk tolerance.
On the date of publication, Jim Van Meerten did not have (either directly or indirectly) positions in any of the securities mentioned in this article. All information and data in this article is solely for informational purposes. For more information please view the Barchart Disclosure Policy here.
More news from Barchart


