Becton, Dickinson and Company (BDX) develops, manufactures, and sells medical supplies, devices, laboratory equipment, and diagnostic products. Valued at $55.4 billion by market cap, the company offers solutions that help advance medical research and genomics, enhance the diagnosis of infectious diseases and cancer, improve medication management, and promote infection prevention.
Companies worth $10 billion or more are generally described as “large-cap stocks,” and BDX perfectly fits that description, with its market cap exceeding this mark, underscoring its size, influence, and dominance within the medical instruments & supplies industry. BDX excels in medical technology, with a strong global brand, an extensive distribution network, and a broad product portfolio. Its commitment to innovation, significant R&D investments, and strategic acquisitions drives growth, while its robust manufacturing and supply chain ensure reliable product delivery, positioning BDX as a leader in the healthcare industry.
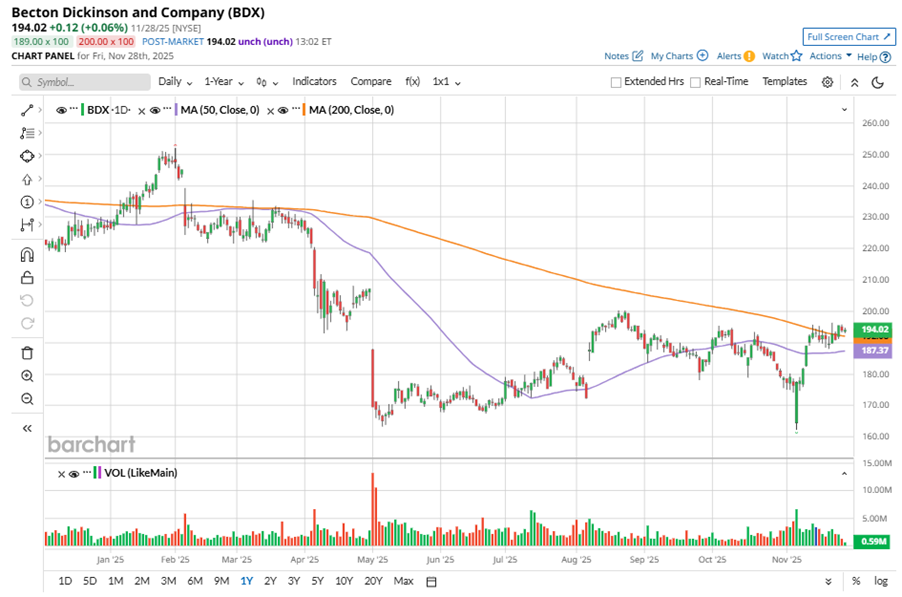
Despite its notable strength, BDX slipped 23% from its 52-week high of $251.99, achieved on Feb. 3. Over the past three months, BDX stock gained 1.5%, underperforming the Nasdaq Composite’s ($NASX) 7.7% gains during the same time frame.
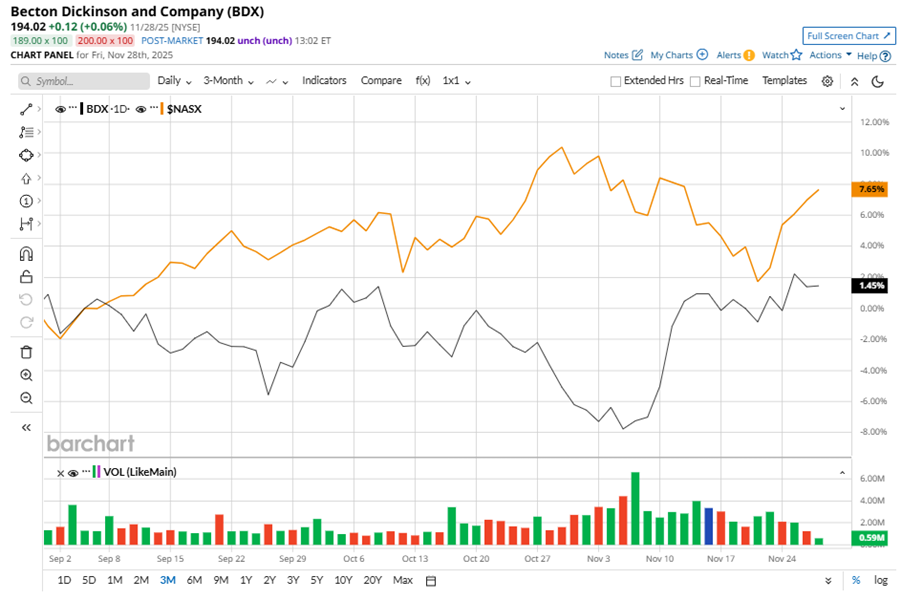
In the longer term, shares of BDX fell 14.5% on a YTD basis and dipped 12.6% over the past 52 weeks, notably underperforming NASX’s YTD gains of 21% and 22.6% returns over the last year.
To confirm the recent bullish trend, BDX has been trading above its 50-day moving average since mid-November. Despite the negative price momentum throughout the year, the stock has been trading above its 200-day moving average recently.
BDX's underperformance reflects ongoing macro challenges, including vaccine demand and biosciences research headwinds.
On Nov. 6, BDX shares closed up marginally after reporting its Q4 results. Its adjusted EPS of $3.96 exceeded Wall Street expectations of $3.92. The company’s revenue was $5.9 billion, meeting Wall Street forecasts. BDX expects full-year adjusted EPS in the range of $14.75 to $15.05.
BDX’s rival, Solventum Corporation (SOLV) shares have taken the lead over the stock, with a 17.6% gain over the past 52 weeks and a 29.1% uptick on a YTD basis.
Wall Street analysts are reasonably bullish on BDX’s prospects. The stock has a consensus “Moderate Buy” rating from the 13 analysts covering it, and the mean price target of $206.91 suggests a potential upside of 6.6% from current price levels.
On the date of publication, Neha Panjwani did not have (either directly or indirectly) positions in any of the securities mentioned in this article. All information and data in this article is solely for informational purposes. For more information please view the Barchart Disclosure Policy here.
More news from Barchart


