ETFOptimize | High-performance ETF-based Investment Strategies

Quantitative strategies, Wall Street-caliber research, and insightful market analysis since 1998.


ETFOptimize | HOME
Close Window

Brown-Forman Stock: Is BF.B Underperforming the Consumer Staples Sector?

Louisville, Kentucky-based Brown-Forman Corporation (BF.B) manufactures, distills, bottles, imports, exports, markets, and sells various alcoholic beverages. Valued at $14 billion by market cap, the company’s products include branded whiskey, vodka, wines, tequila, bourbon, and gin.

Companies worth $10 billion or more are generally described as “large-cap stocks,” and BF.B perfectly fits that description, with its market cap exceeding this mark, underscoring its size, influence, and dominance within the beverages - wineries & distilleries industry. Brown-Forman's strengths include its premium spirits portfolio, led by iconic brands such as Jack Daniel's, and its strong brand equity, which enables premium pricing and high profit margins. The company has also taken proactive steps to enhance operational efficiency through restructuring, aiming for long-term savings and a more agile organization.


Despite its notable strength, BF.B slipped 45.2% from its 52-week high of $46.22, achieved on Dec. 5, 2024. Over the past three months, BF.B stock gained 8%, outperforming the Consumer Staples Select Sector SPDR Fund’s (XLP) 3.4% dip during the same time frame.

www.barchart.com

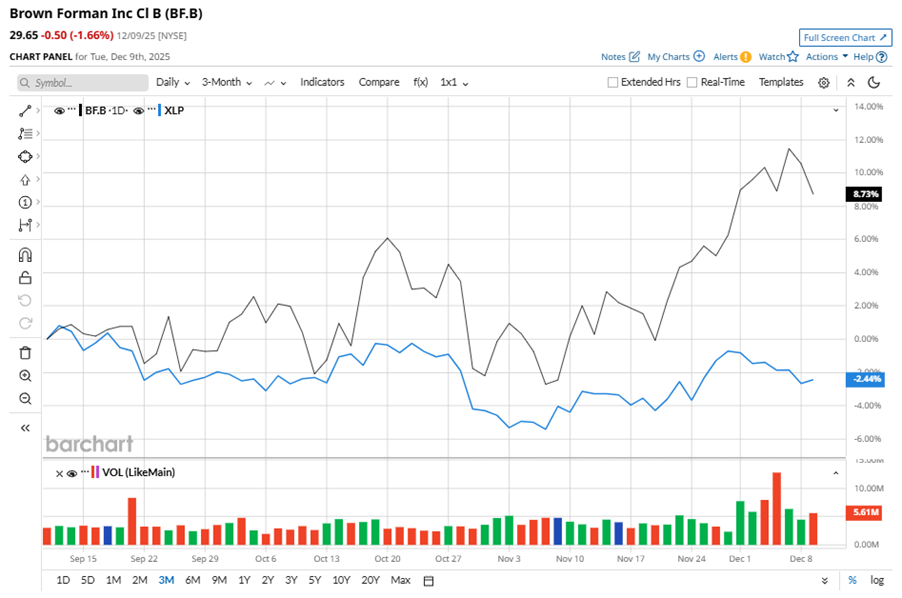
In the longer term, shares of BF.B rose 7.2% on a six-month basis, outperforming XLP’s six-month losses of 4.4%. However, the stock fell 34.4% over the past 52 weeks, underperforming XLP’s 5.2% losses over the last year.

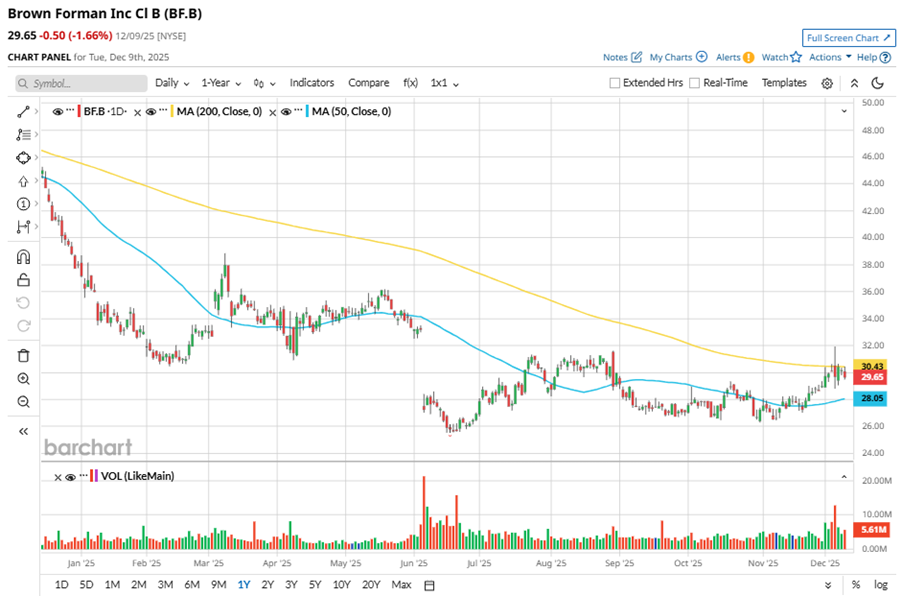
To confirm the bearish trend, BF.B has been trading below its 200-day moving average over the past year, with minor fluctuations. However, the stock is trading above its 50-day moving average since mid-November. 

www.barchart.com

On Dec. 4, BF.B shares closed down more than 1% after reporting its Q2 results. Its net sales stood at $1 billion, down 5.4% year over year. The company’s EPS declined 14.5% year over year to $0.47.

In the competitive arena of beverages - wineries & distilleries, Diageo plc (DEO) has taken the lead over BF.B, with 31% losses over the past 52 weeks, but lagged behind the stock with a 20.4% downtick on a six-month basis.

Wall Street analysts are cautious on BF.B’s prospects. The stock has a consensus “Hold” rating from the 18 analysts covering it, and the mean price target of $30.56 suggests a potential upside of 3.1% from current price levels.


On the date of publication, Neha Panjwani did not have (either directly or indirectly) positions in any of the securities mentioned in this article. All information and data in this article is solely for informational purposes. For more information please view the Barchart Disclosure Policy here.


More news from Barchart

Recent Quotes

View More
Symbol Price Change (%)
AMZN  226.76
+5.49 (2.48%)
AAPL  272.19
+0.35 (0.13%)
AMD  201.06
+2.95 (1.49%)
BAC  54.26
-0.29 (-0.53%)
GOOG  303.75
+5.69 (1.91%)
META  664.45
+14.95 (2.30%)
MSFT  483.98
+7.86 (1.65%)
NVDA  174.14
+3.20 (1.87%)
ORCL  180.03
+1.57 (0.88%)
TSLA  483.37
+16.11 (3.45%)
Stock Quote API & Stock News API supplied by www.cloudquote.io
Quotes delayed at least 20 minutes.
By accessing this page, you agree to the Privacy Policy and Terms Of Service.


IntelligentValue Home
Close Window

DISCLAIMER

All content herein is issued solely for informational purposes and is not to be construed as an offer to sell or the solicitation of an offer to buy, nor should it be interpreted as a recommendation to buy, hold or sell (short or otherwise) any security.  All opinions, analyses, and information included herein are based on sources believed to be reliable, but no representation or warranty of any kind, expressed or implied, is made including but not limited to any representation or warranty concerning accuracy, completeness, correctness, timeliness or appropriateness. We undertake no obligation to update such opinions, analysis or information. You should independently verify all information contained on this website. Some information is based on analysis of past performance or hypothetical performance results, which have inherent limitations. We make no representation that any particular equity or strategy will or is likely to achieve profits or losses similar to those shown. Shareholders, employees, writers, contractors, and affiliates associated with ETFOptimize.com may have ownership positions in the securities that are mentioned. If you are not sure if ETFs, algorithmic investing, or a particular investment is right for you, you are urged to consult with a Registered Investment Advisor (RIA). Neither this website nor anyone associated with producing its content are Registered Investment Advisors, and no attempt is made herein to substitute for personalized, professional investment advice. Neither ETFOptimize.com, Global Alpha Investments, Inc., nor its employees, service providers, associates, or affiliates are responsible for any investment losses you may incur as a result of using the information provided herein. Remember that past investment returns may not be indicative of future returns.

Copyright © 1998-2017 ETFOptimize.com, a publication of Optimized Investments, Inc. All rights reserved.