A rare pattern just appeared on Bitcoin’s (BTCUSD) weekly chart—and according to Barchart Senior Market Strategist John Rowland, CMT, it’s one he has traded professionally for decades.
It’s called the three-candle drop (3CD), sometimes referred to as the “3-candle crash” or the “picture of a crash.” But here’s the twist:
➡️ It’s not a bearish pattern. It’s a potential buying signal.
When the pattern plays out as expected, it often marks a capitulation point for sellers and the setup for a powerful reversal.
Bitcoin may now be entering that exact phase, but it still needs to achieve the technical confirmation criteria that Rowland outlined during a recent Market on Close livestream.
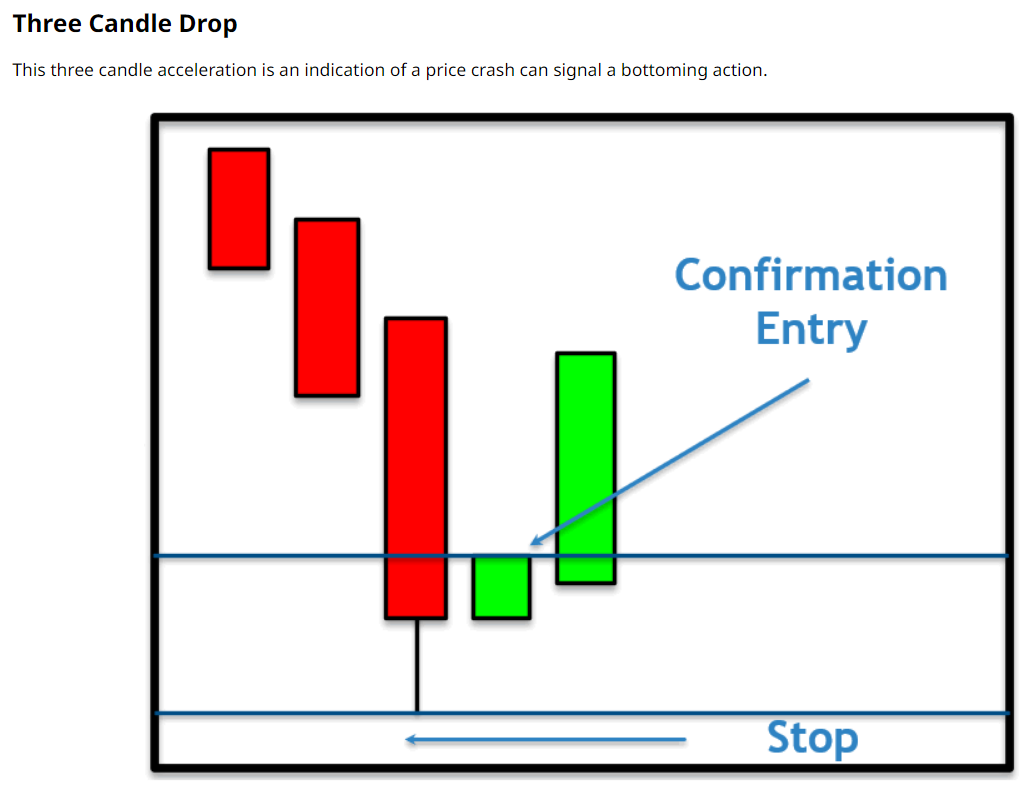
What is the 3-Candle Drop?
According to Rowland, this is one of the purest capitulation patterns in technical analysis. Here are the highlights of a 3CD:
- Three consecutive large red candles
- Each candle gets larger as momentum accelerates
- Selling pressure overwhelms the market
- Fear peaks → final capitulation
- Then, a potential reversal forms
How to Confirm the Buy Signal
The 3-candle drop points to a potential buying opportunity, but the signal isn’t valid until two conditions occur:
- The first weekly candle closes green after the “crash” pattern. This tells us that selling pressure has finally exhausted itself.
- The following candle trades above the high set by that green candle in #1. This is the official buy confirmation.
Key Levels: The Resistance Breaks That Must Hold
Once confirmation occurs, the pattern uses the “breaks” between the three crash candles as milestone targets. Here’s how that shapes up for Bitcoin right now:
Level 1: $94,000–$96,000
The first resistance zone where the last red candle occurred. A weekly close above this region would be a significant bullish development.
Level 2: $103,900
The midpoint between the second and third candles is around $103,900. This level acts as a structural target.
Level 3 (The Big One): $109,000-$111,000
The origin of the selloff is near $109,000-$111,000. If Bitcoin can reclaim this zone, the 3CD allows traders to project the next move:
➡️ Peak → Trough distance added to the breakout point
➡️ This projects out to a price target of $141,685 on the upside
John notes:
“This is a pattern I made a living trading… and it rarely appears at the weekly level.”
The Bearish Spoiler
If Bitcoin fails to close above $94K on a weekly basis and instead:
- Breaks $83,500, the low of the first green candle
- Takes out the recent $80K low
That suggests that the downtrend will resume, and the potential buying opportunity is invalidated. This is the most important risk factor traders must watch.
The Bottom Line on Bitcoin’s Chart
Bitcoin is at an inflection point, and a rare technical chart pattern that helped John Rowland build his trading career has appeared. Now, traders must watch to see whether the market confirms or invalidates this potential capitulation.
What happens around $94K and $80K could determine whether Bitcoin:
➡️ Sets up for a run toward $142K, or
➡️ Begins a deeper corrective phase
To see John explain the pattern — and what he’ll be watching next — watch the clip:
- Stream the full Market on Close episode
- Chart Bitcoin’s key levels using Barchart’s Interactive tools
On the date of publication, Barchart Insights did not have (either directly or indirectly) positions in any of the securities mentioned in this article. All information and data in this article is solely for informational purposes. For more information please view the Barchart Disclosure Policy here.
More news from Barchart


