ETFOptimize | High-performance ETF-based Investment Strategies

Quantitative strategies, Wall Street-caliber research, and insightful market analysis since 1998.


ETFOptimize | HOME
Close Window

How Is PPL Corporation's Stock Performance Compared to Other Utilities Stocks?

PPL Corporation (PPL), headquartered in Allentown, Pennsylvania, provides electricity and natural gas to approximately 3.6 million customers. Valued at $25 billion by market cap, the company generates electricity at power plants and markets wholesale and retail energy and natural gas. It also delivers natural gas to customers in Kentucky and Rhode Island and generates electricity from power plants in Kentucky.

Companies worth $10 billion or more are generally described as “large-cap stocks.” PPL effortlessly fits that bill, with its market cap exceeding this mark, underscoring its size, influence, and dominance within the utilities - regulated electric industry. PPL's strengths include its stable, regulated business model, providing predictable revenue and reasonable returns, along with a diversified presence. Its resilient segments, including regulated electricity and gas distribution operations in Kentucky and large customer bases in Pennsylvania and Rhode Island, contribute to financial stability.


Despite its notable strength, PPL slipped 11.7% from its 52-week high of $38.27, achieved on Oct. 16. Over the past three months, PPL stock has declined 5.4%, underperforming the Utilities Select Sector SPDR Fund’s (XLU2.8% gains during the same time frame.

www.barchart.com

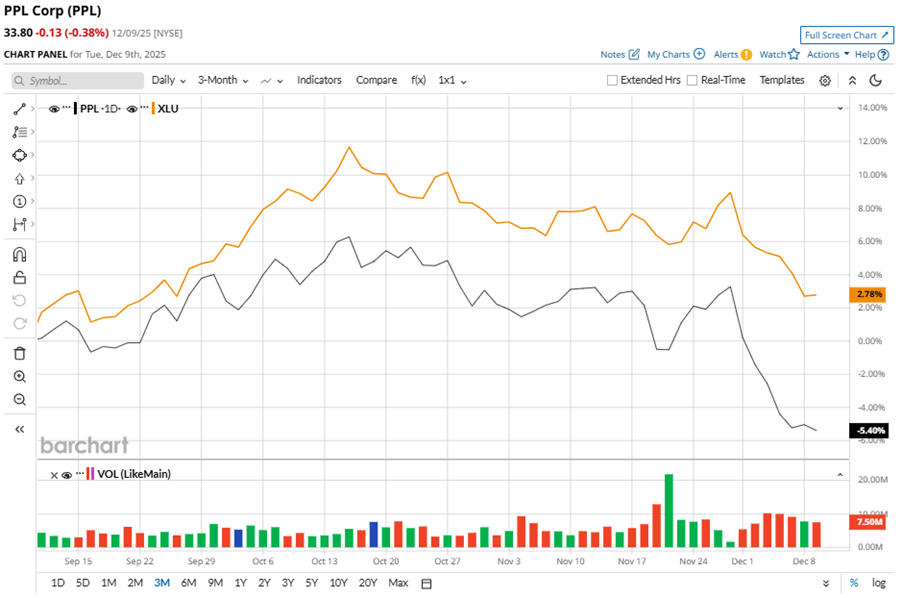
In the longer term, shares of PPL fell marginally on a six-month basis but climbed 2% over the past 52 weeks, underperforming XLU’s six-month gains of 6% and 8.7% returns over the last year.

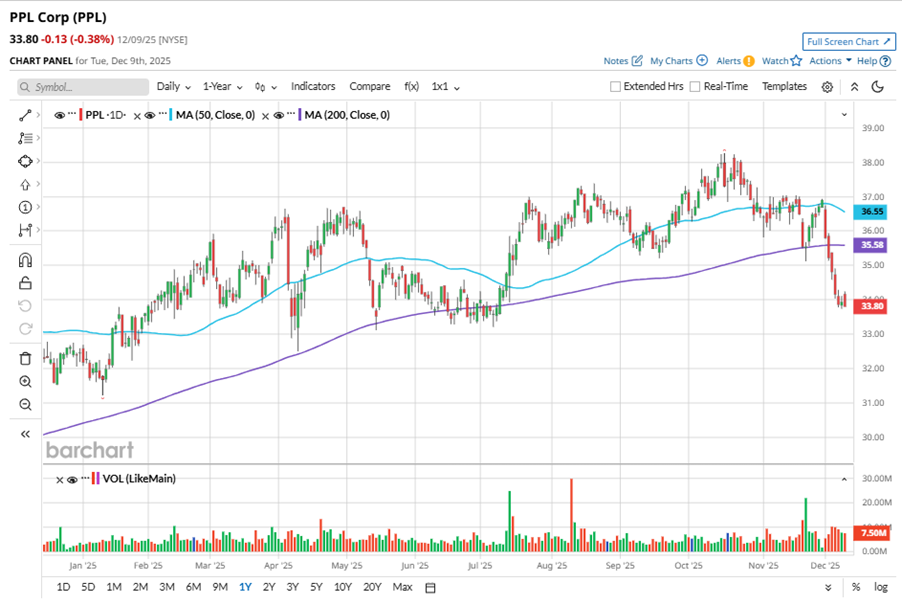
To confirm the bearish trend, PPL has been trading below its 200-day moving average recently. The stock has been trading below its 50-day moving average since mid-November, experiencing minor fluctuations. 

www.barchart.com

On Nov. 5, PPL shares closed up marginally after reporting its Q3 results. Its adjusted EPS of $0.48 exceeded Wall Street expectations of $0.46. The company’s revenue was $2.24 billion, exceeding Wall Street's $2.17 billion forecast. PPL expects full-year adjusted EPS in the range of $1.78 to $1.84.

In the competitive arena of utilities - regulated electric, Eversource Energy (ES) has taken the lead over PPL, showing resilience with a 3.3% uptick on a six-month basis and 12.6% gains over the past 52 weeks.

Wall Street analysts are reasonably bullish on PPL’s prospects. The stock has a consensus “Moderate Buy” rating from the 16 analysts covering it, and the mean price target of $40.93 suggests a potential upside of 21.1% from current price levels.


On the date of publication, Neha Panjwani did not have (either directly or indirectly) positions in any of the securities mentioned in this article. All information and data in this article is solely for informational purposes. For more information please view the Barchart Disclosure Policy here.


More news from Barchart

Recent Quotes

View More
Symbol Price Change (%)
AMZN  222.56
+0.02 (0.01%)
AAPL  274.61
+0.50 (0.18%)
AMD  209.17
+1.59 (0.77%)
BAC  54.81
-0.52 (-0.94%)
GOOG  307.73
-1.59 (-0.51%)
META  657.15
+9.64 (1.49%)
MSFT  476.39
+1.57 (0.33%)
NVDA  177.72
+1.43 (0.81%)
ORCL  188.65
+3.73 (2.02%)
TSLA  489.88
+14.57 (3.07%)
Stock Quote API & Stock News API supplied by www.cloudquote.io
Quotes delayed at least 20 minutes.
By accessing this page, you agree to the Privacy Policy and Terms Of Service.


IntelligentValue Home
Close Window

DISCLAIMER

All content herein is issued solely for informational purposes and is not to be construed as an offer to sell or the solicitation of an offer to buy, nor should it be interpreted as a recommendation to buy, hold or sell (short or otherwise) any security.  All opinions, analyses, and information included herein are based on sources believed to be reliable, but no representation or warranty of any kind, expressed or implied, is made including but not limited to any representation or warranty concerning accuracy, completeness, correctness, timeliness or appropriateness. We undertake no obligation to update such opinions, analysis or information. You should independently verify all information contained on this website. Some information is based on analysis of past performance or hypothetical performance results, which have inherent limitations. We make no representation that any particular equity or strategy will or is likely to achieve profits or losses similar to those shown. Shareholders, employees, writers, contractors, and affiliates associated with ETFOptimize.com may have ownership positions in the securities that are mentioned. If you are not sure if ETFs, algorithmic investing, or a particular investment is right for you, you are urged to consult with a Registered Investment Advisor (RIA). Neither this website nor anyone associated with producing its content are Registered Investment Advisors, and no attempt is made herein to substitute for personalized, professional investment advice. Neither ETFOptimize.com, Global Alpha Investments, Inc., nor its employees, service providers, associates, or affiliates are responsible for any investment losses you may incur as a result of using the information provided herein. Remember that past investment returns may not be indicative of future returns.

Copyright © 1998-2017 ETFOptimize.com, a publication of Optimized Investments, Inc. All rights reserved.