Atlanta, Georgia-based Rollins, Inc. (ROL) provides pest and wildlife control services to residential and commercial customers in the United States and internationally. With a market cap of $29.3 billion, Rollins offers pest control services to residential properties, protecting them from common pests, including rodents, insects, and wildlife.
Companies worth $10 billion or more are generally described as "large-cap stocks." Rollins fits right into that category, with its market cap exceeding this threshold, reflecting its substantial size, influence, and dominance in the pest and wildlife control services space.
Rollins touched its all-time high of $61.84 on Nov. 28 and is currently trading 6.2% below that peak. Meanwhile, ROL stock prices have inched up 1.2% over the past three months, outpacing the Consumer Discretionary Select Sector SPDR Fund’s (XLY) marginal 11 bps uptick during the same time frame.
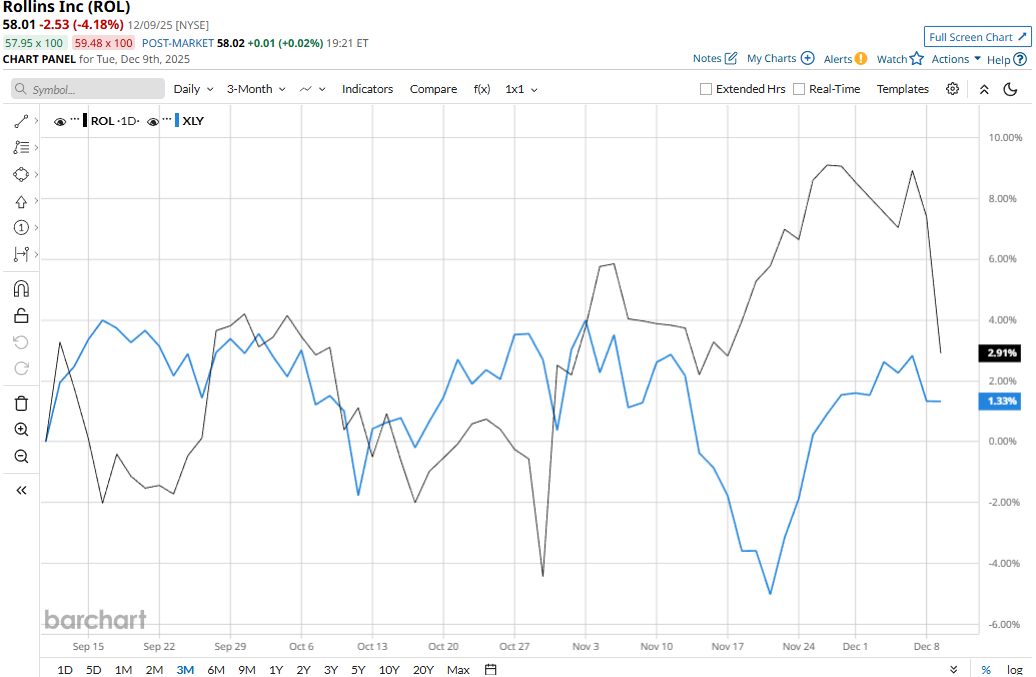
Rollins’ performance has remained impressive over the longer term as well. ROL stock prices have soared 25.2% on a YTD basis and gained 19.2% over the past 52 weeks, outpacing XLY’s 5.2% gains in 2025 and 1.7% uptick over the past year.
ROL stock has traded mostly above its 50-day and 200-day moving averages since mid-January with some fluctuations, underscoring its bullish trend.
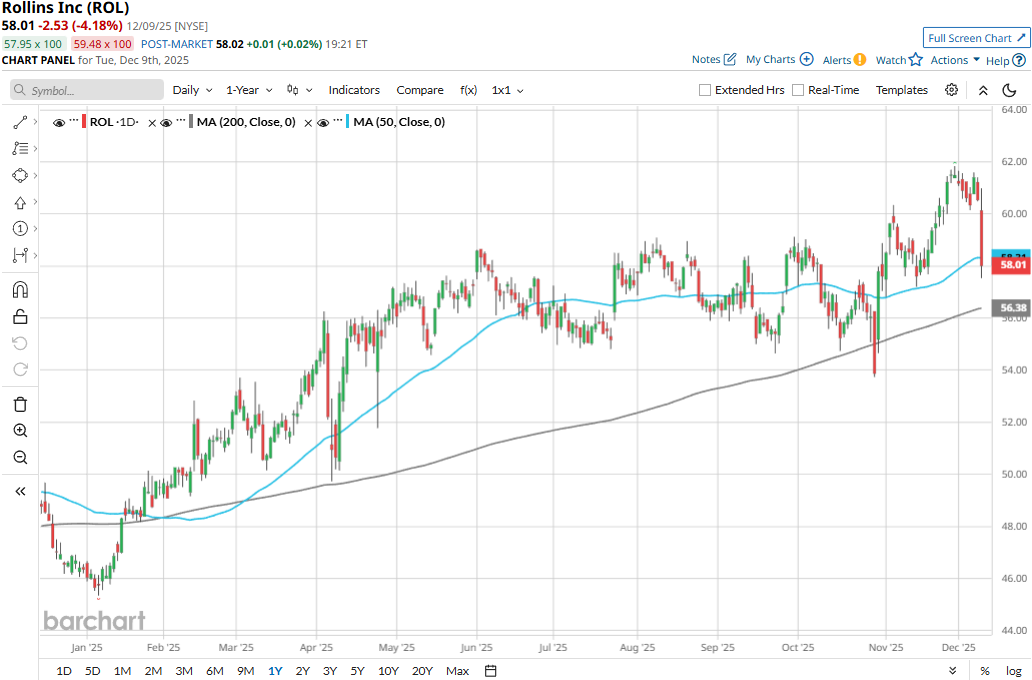
Rollins’ stock prices surged 7.3% in the trading session following the release of its impressive Q3 results on Oct. 29. The company has continued to observe a significant surge in organic revenues along with solid contributions from acquisitions. Overall, the company’s topline surged 12% year-over-year to a record $1 billion, beating the Street’s expectations by 42 bps. Further, driven by the impact of leverage, Rollins recorded solid margin expansion, leading to a 20.7% surge in adjusted EPS to $0.35, surpassing the consensus estimates by 9.4%.
Meanwhile, Rollins has also outperformed its peer Rentokil Initial plc’s (RTO) 9.8% gains on a YTD basis and 4.5% returns over the past 52 weeks.
Among the 15 analysts covering the ROL stock, the consensus rating is a “Moderate Buy.” As of writing, its mean price target of $64.22 suggests a 10.7% upside potential from current price levels.
On the date of publication, Aditya Sarawgi did not have (either directly or indirectly) positions in any of the securities mentioned in this article. All information and data in this article is solely for informational purposes. For more information please view the Barchart Disclosure Policy here.
More news from Barchart
- Forget The Fed and Buy This Dividend Stock for 2026
- Morgan Stanley Is Sweetening on MP Materials Stock Following ‘Historic Deal.’ Should You Buy MP Here?
- This Semiconductor Giant Is in Talks With Microsoft for Custom Chips. Should You Buy Its Stock Now?
- Is MicroStrategy Stock a Buy Now Amid the Bitcoin Rally?


