With a market cap of $26.6 billion, Broadridge Financial Solutions, Inc. (BR) is a global fintech and outsourcing provider that delivers investor communications, trade processing, and technology solutions to banks, broker-dealers, asset managers, and corporate issuers. Through its two segments: Investor Communication Solutions and Global Technology & Operations, the company delivers services ranging from regulatory and shareholder communications to front-to-back securities processing and data-driven solutions.
Companies valued at $10 billion or more are generally classified as “large-cap” stocks, and Broadridge Financial Solutions fits this criterion perfectly. The New York-based company plays a critical role in financial market infrastructure, offering services such as proxy voting, shareholder disclosure, post-trade management, and wealth and investment management platforms.
However, shares of BR have declined 17.1% from its 52-week high of $271.91. BR stock has dropped 10.7% over the past three months, underperforming the Dow Jones Industrial Average’s ($DOWI) 4% rise over the same time frame.
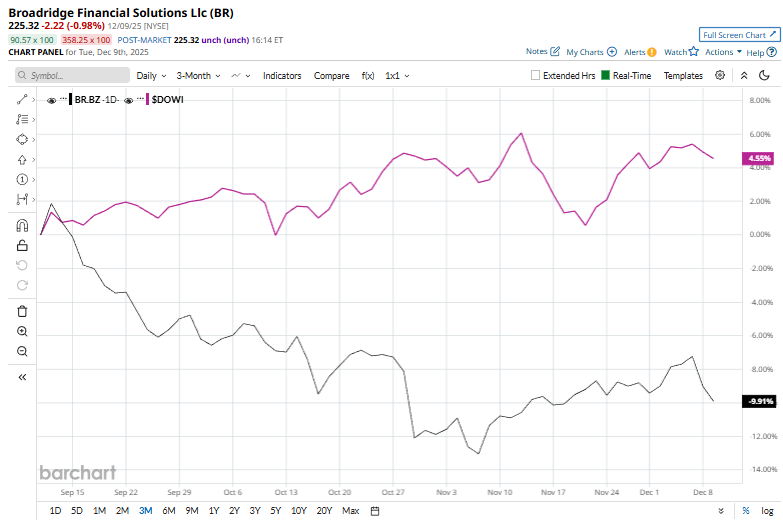
In the longer term, BR stock is down marginally on a YTD basis, lagging behind DOW’s 11.2% gain. Moreover, shares of the fintech firm have plunged 3.5% over the past 52 weeks, compared to DOWI’s 7.1% return over the same time frame.
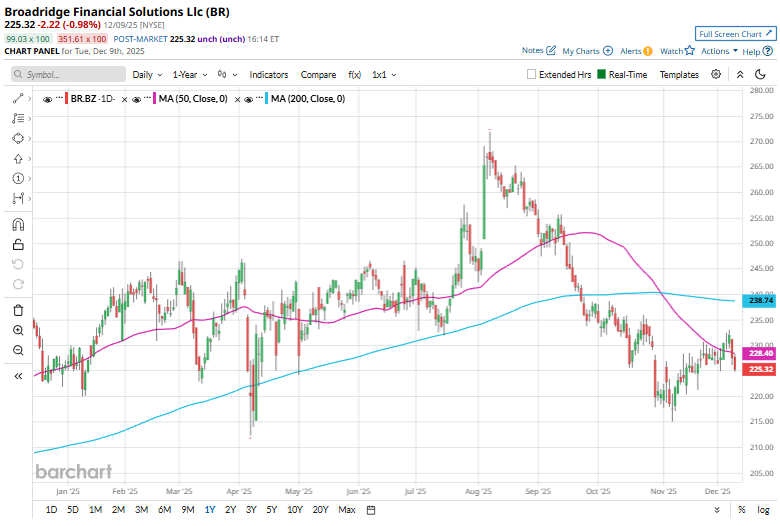
BR shares have been trading below their 200-day moving average since mid-September and have recently dipped below their 50-day moving average, reinforcing a downtrend.
Broadridge’s shares inched marginally higher on November 19 after the company announced a strategic partnership with Xceptor to integrate Xceptor Tax into Broadridge’s Global Tax and Client Reporting platform. By combining Broadridge’s asset-servicing infrastructure with Xceptor’s intelligent automation, the platform streamlines data flows, centralizes documentation, and enhances compliance. The integrated system is designed to help financial institutions accelerate tax-reclaim processing, reduce operational risk and cost, and manage increasingly complex global tax requirements.
In comparison, rival Leidos Holdings, Inc. (LDOS) has outperformed Broadridge stock. LDOS stock has gained 28.4% on a YTD basis and 15.4% over the past 52 weeks.
Due to the stock’s weak performance, analysts remain cautious on BR. The stock has a consensus rating of “Hold” from the nine analysts in coverage, and the mean price target of $266.43 is a premium of 18.2% to current levels.
On the date of publication, Kritika Sarmah did not have (either directly or indirectly) positions in any of the securities mentioned in this article. All information and data in this article is solely for informational purposes. For more information please view the Barchart Disclosure Policy here.
More news from Barchart
- Stock Index Futures Dip Amid Caution Ahead of Fed Rate Decision
- Forget The Fed and Buy This Dividend Stock for 2026
- Morgan Stanley Is Sweetening on MP Materials Stock Following ‘Historic Deal.’ Should You Buy MP Here?
- This Semiconductor Giant Is in Talks With Microsoft for Custom Chips. Should You Buy Its Stock Now?


