Valued at a market cap of $24.2 billion, Steel Dynamics, Inc. (STLD) is a steel producer and metal recycler based in Fort Wayne, Indiana. It produces hot-rolled, cold-rolled, coated sheet steel, structural beams and rails, specialty steel, while also running extensive metals-recycling operations, downstream steel fabrication, and aluminum production.
Companies valued at $10 billion or more are typically classified as “large-cap stocks,” and STLD fits the label perfectly, with its market cap exceeding this threshold, underscoring its size, influence, and dominance within the steel industry. With a broad product portfolio, significant steel-making capacity, and a vertically integrated business model, the company stands out as a major U.S. player in steel & industrial materials.
This steel company is currently trading 4.3% below its 52-week high of $172.94, reached on Dec. 3. Shares of STLD have rallied 27% over the past three months, outperforming the Dow Jones Industrial Average’s ($DOWI) 4% rise during the same time frame.
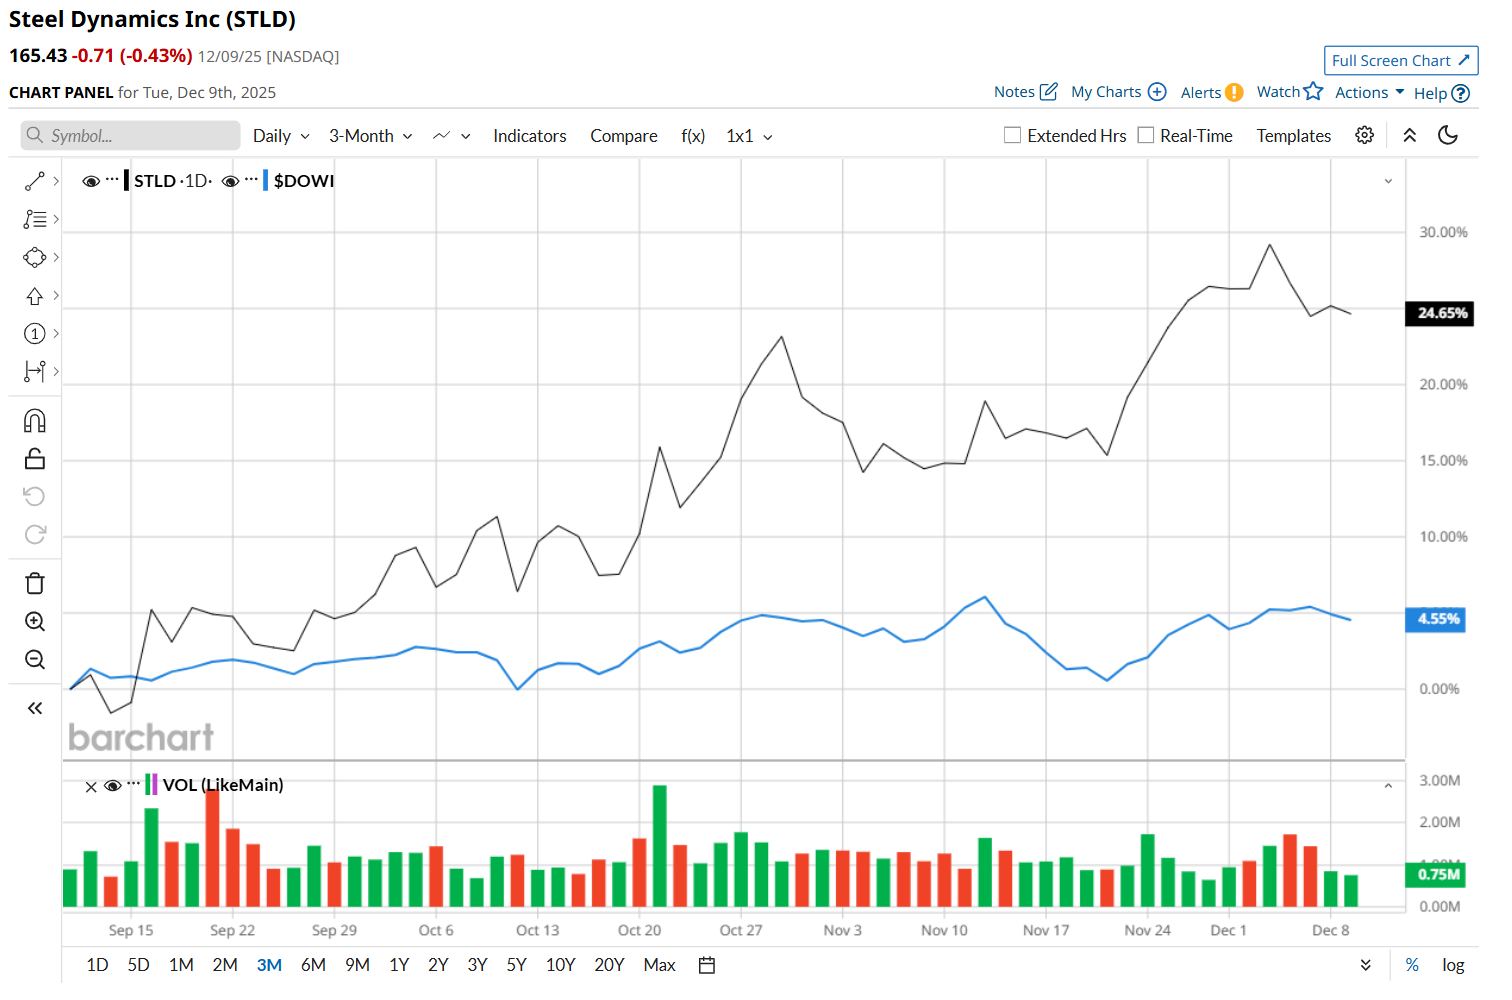
In the longer term, STLD has soared 19.7% over the past 52 weeks, outpacing DOWI’s 7.1% uptick over the same time frame. Moreover, on a YTD basis, shares of STLD are up 45%, compared to DOWI’s 11.8% return.
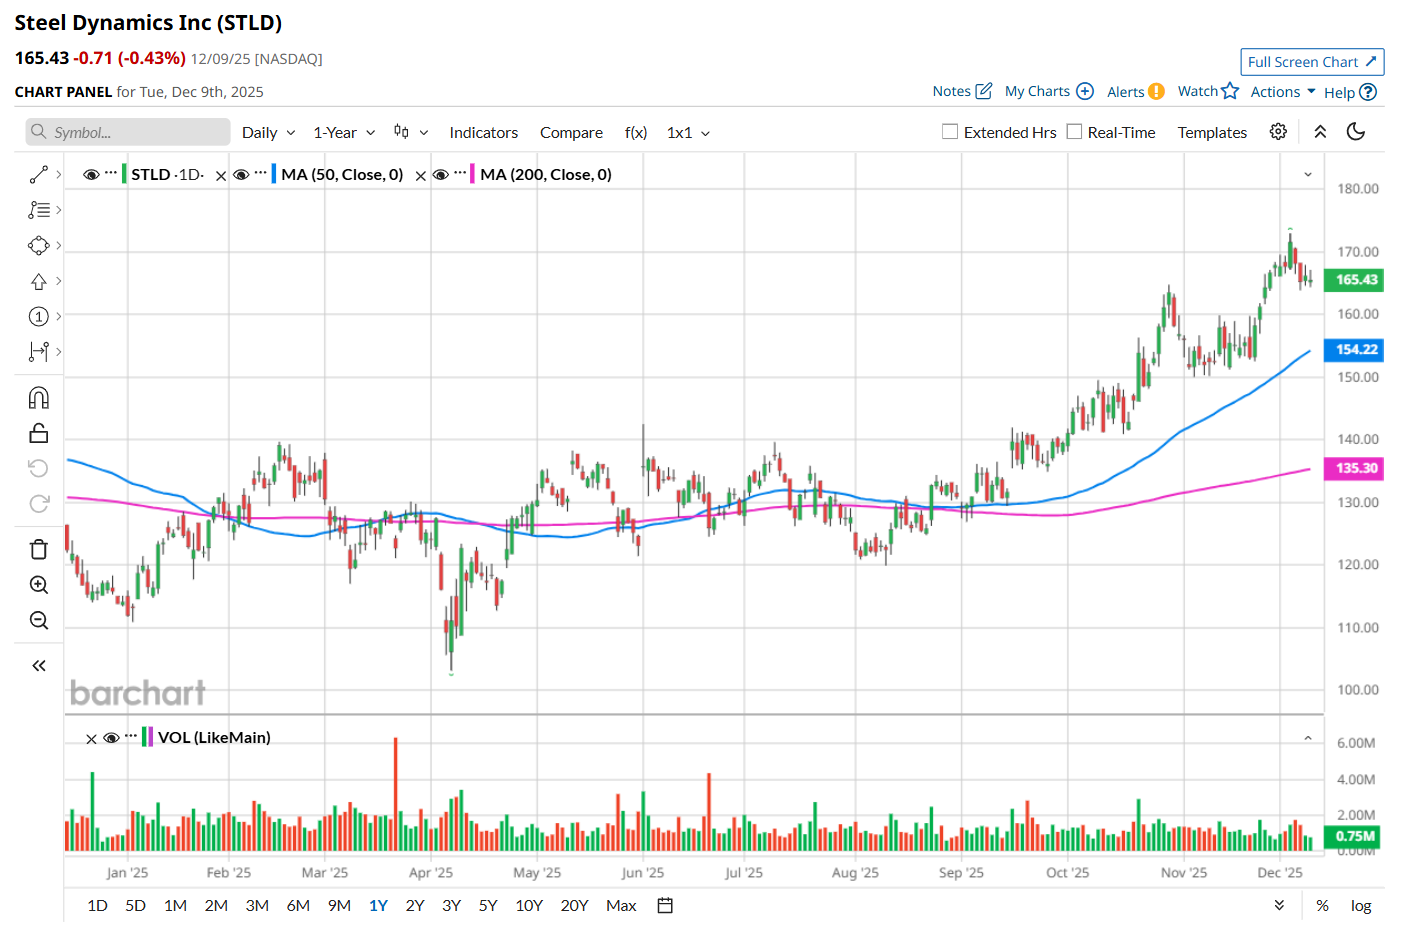
To confirm its bullish trend, STLD has been trading above its 200-day and 50-day moving averages since late August.
On Oct. 20, shares of STLD surged 2.5% after reporting better-than-expected Q3 results. The company’s net sales increased 11.2% year-over-year to $4.8 billion, surpassing consensus estimates by 3%. Moreover, its EPS of $2.74 improved 33.7% from the year-ago quarter, topping analyst expectations of $2.66.
STLD has also outpaced its rival, Nucor Corporation (NUE), which gained 9.4% over the past 52 weeks and 35.5% on a YTD basis.
Given STLD’s recent outperformance, analysts remain moderately optimistic about its prospects. The stock has a consensus rating of "Moderate Buy” from the 13 analysts covering it, and the mean price target of $172 suggests a 4% premium to its current price levels.
On the date of publication, Neharika Jain did not have (either directly or indirectly) positions in any of the securities mentioned in this article. All information and data in this article is solely for informational purposes. For more information please view the Barchart Disclosure Policy here.
More news from Barchart
- VICI Properties Hits a New 52-Week Low: Is It Time for Income Investors to Place a Bet?
- Salesforce Could Rebrand to Focus on Its AI Offerings. Should You Buy the Dip in CRM Stock Here?
- Creating a 39% “Dividend” on MRVL Stock Using Options
- Stock Index Futures Muted Amid Caution Ahead of Fed Rate Decision


