Veralto Corporation (VLTO) is an industrial-technology company, headquartered in Waltham, Massachusetts. The firm operates globally in two primary segments: Water Quality (WQ) offering water analytics, treatment and purification solutions under brands like Hach, Trojan Technologies, and ChemTreat, and Product Quality & Innovation (PQI) providing marking, coding, packaging, and color-management solutions through brands such as Videojet, Esko, X-Rite, Linx, and Pantone. Veralto's market cap stands at around $24.4 billion.
Companies valued at $10 billion or more are typically classified as "large-cap stocks," and Veralto fits the label perfectly, with its market cap exceeding this threshold, underscoring its size, influence, and dominance within the pollution & treatment controls industry. The company combines scientific expertise, innovation, and a strong commitment to sustainability, helping customers meet rising regulatory standards and achieve long-term operational resilience.
The stock is currently trading 10.6% below its 52-week high of $110.11, reached on Aug. 22. Shares have declined 7.1% over the past three months, underperforming the S&P 500 Index's ($SPX) 5% gains during the same time frame.
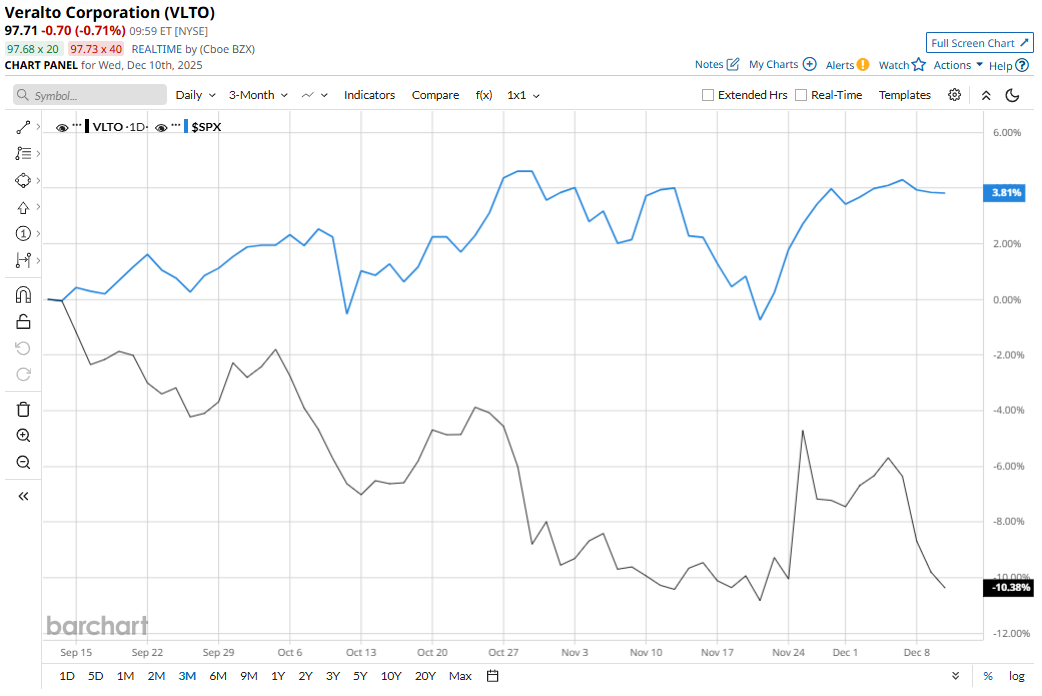
In the longer term, VLTO has fallen 7.9% over the past 52 weeks and 3.8% on a year-to-date (YTD) basis, underperforming the SPX's 13.3% rise over the past year and 16.3% gains this year.
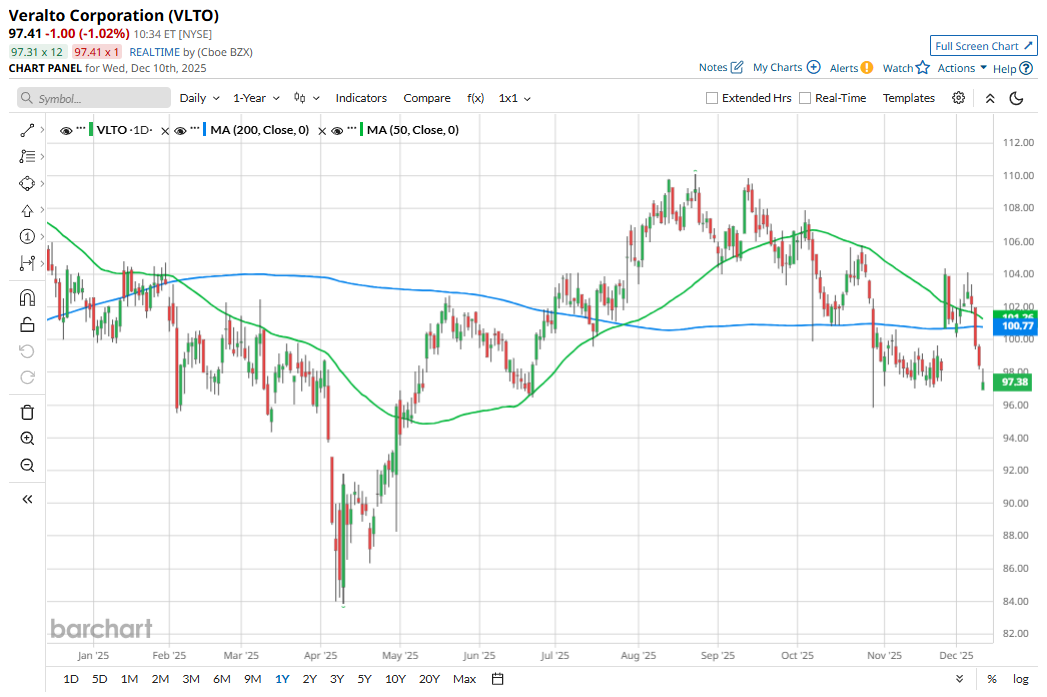
To confirm the bearish trend, the stock has been largely trading below the 50-day moving average since early October and below the 200-day moving average since late October, with some fluctuations lately.
The stock has been pressured amid market reaction to a mix of investor caution and structural concerns. There is rising scrutiny of the recent acquisition plan for In-Situ and growing concern that demand weakness in certain regions, such as China, might undermine growth prospects, leaving limited catalysts for significant upside ahead.
VLTO has significantly underperformed its rival, CECO Environmental Corp. (CECO), which surged 70.5% over the past 52 weeks and 89.8% on a YTD basis.
The stock has a consensus rating of "Moderate Buy" from the 18 analysts covering it, and the mean price target of $115.31 suggests a 17.2% premium to its current price levels.
On the date of publication, Subhasree Kar did not have (either directly or indirectly) positions in any of the securities mentioned in this article. All information and data in this article is solely for informational purposes. For more information please view the Barchart Disclosure Policy here.
More news from Barchart
- Do We Have Permission to Buy Bitcoin Yet? Our Top Chart Strategist Maps Out the Path to $141,685
- Could Meta Stock Skyrocket in 2026 If Mark Zuckerberg Declares Another ‘Year of Efficiency’?
- Does IBM’s Major $11 Billion Deal for Confluent Make Its Stock a Buy, Sell, or Hold?
- This Hot Biotech Stock Just Set New All-Time Highs


