Covered calls are a great strategy to add to any portfolio, and can offer enhanced yield from stock holdings, in some case, that can be a significant increase.
To trade a covered call we need to own (or buy) 100 shares of a stock and then sell a call option against that stock position.
The goal is to generate income from the stock holding in addition to any dividends. The premium received from selling the call also covers a small decline in the stock price. However, the trade off is that stock gains are limited above the call option strike price.
High volatility stocks have the highest return potential with covered calls, but they also have the highest risk of an adverse price movement. It’s all about finding a strategy that fits the investors risk tolerance.
Let’s look at a few examples using Barchart’s Covered Call Screener.
This first example shows the results of the screener with the default parameters selected and sorted by option volume.
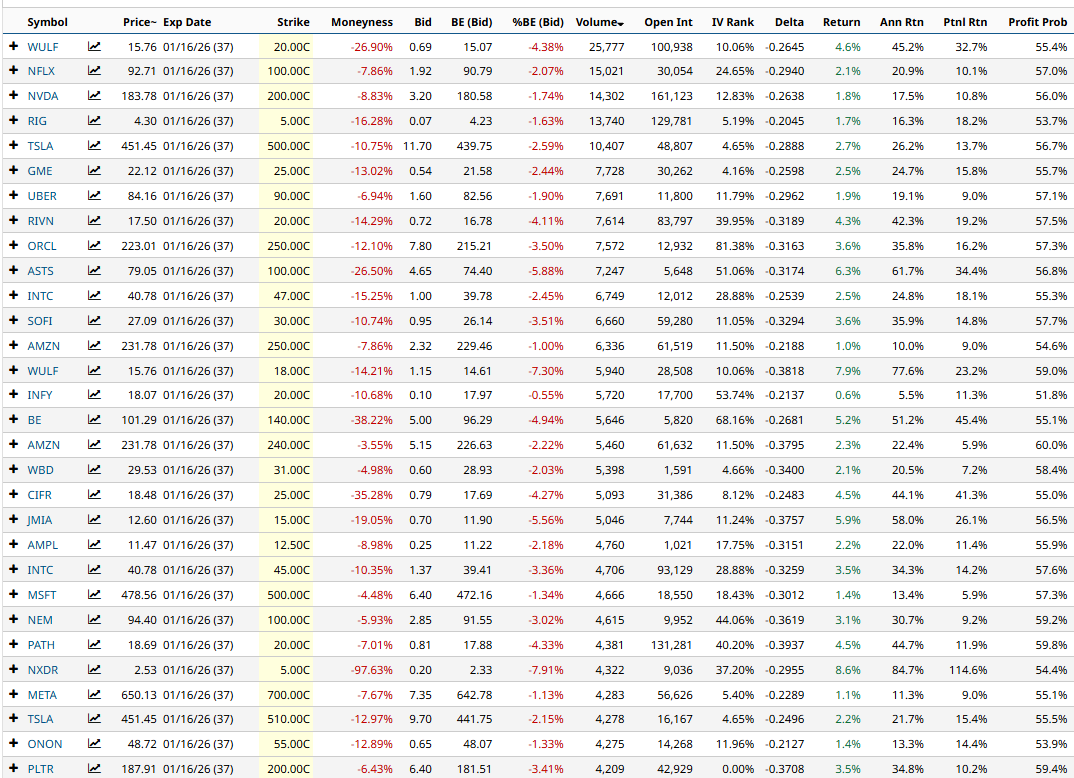
This result returns some stocks with very low market capitalization and, while the returns look great, the risks can also be very high. There are also 522 results, so let’s try and narrow things down a little
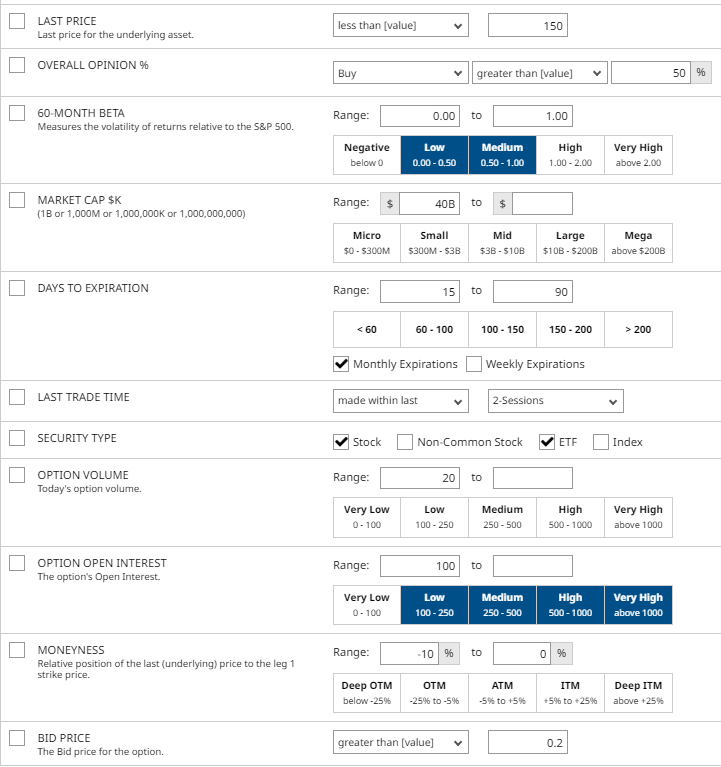
Let’s add the following filters:
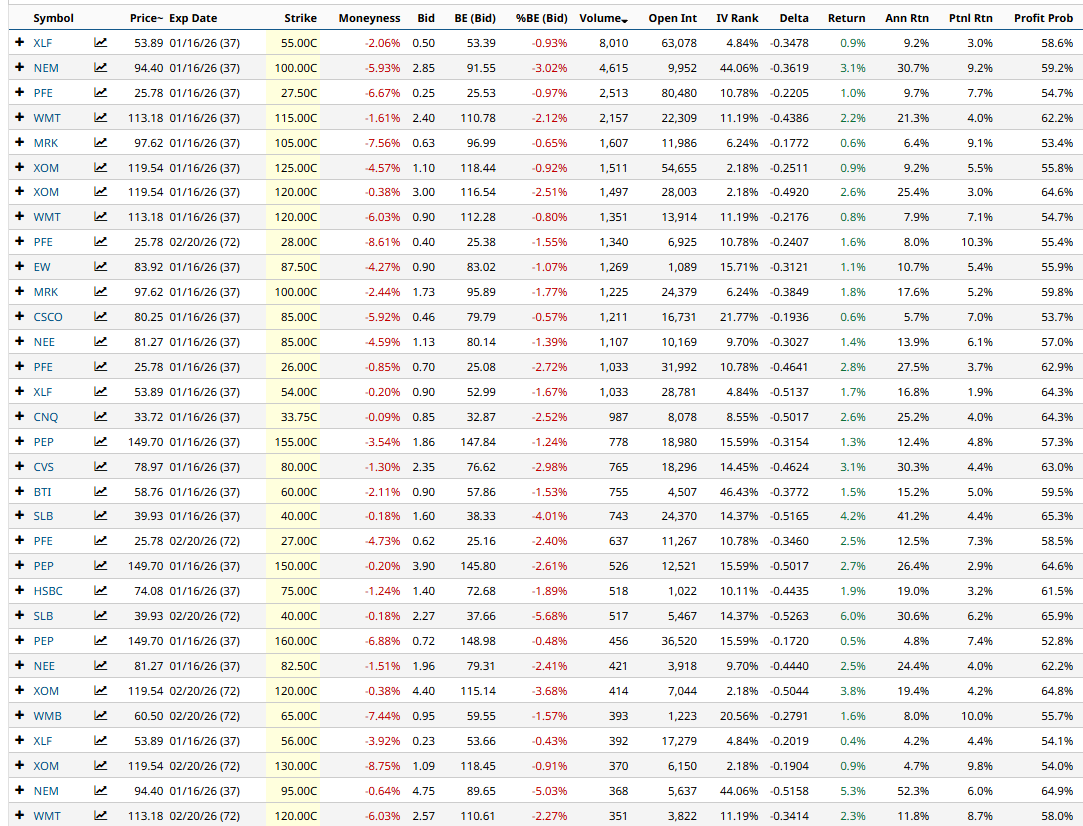
Now, we’re seeing some more mainstream names such as XLF, NEM, PFE, WMT, MRK and XOM.
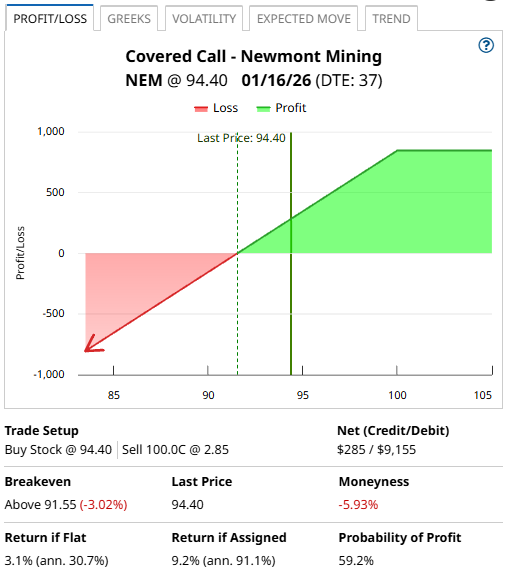
NEM Covered Call Example
Let’s evaluate the first NEM covered call. Buying 100 shares of NEM would cost $9,440.
The January 16th $100-strike call option was trading yesterday for around $2.85, generating $285 in premium per contract for covered call sellers.
Selling the call option generates an income of 3.1% in 37 days, equalling around 30.7% annualized.
If the stock rises above the strike price of $100 at expiration, the return would be 9.2% which is 91.1% annualized.
The breakeven price is equal to the stock purchase price less the premium received, which in this case is $91.55.
NEM is currently followed by 21 analysts with 15 Strong Buy ratings, 2 Moderate Buy ratings and 4 Hold ratings.
The Barchart Technical Opinion rating is a 100% Buy with a Strongest short term outlook on maintaining the current direction.
Long term indicators fully support a continuation of the trend.
The current IV Percentile is 78% which means that the current level of implied volatility is higher than 78% of all occurrences in the last 12 months.
PFE Covered Call Example
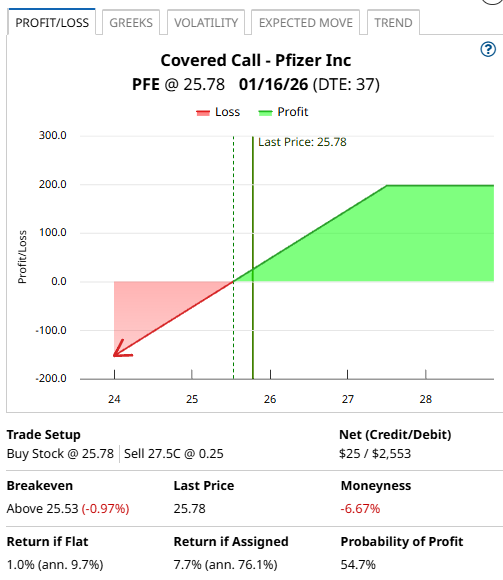
Let’s look at another example, this time using PFE.
Buying 100 shares of PFE would cost $2,578. The January 16th $27.50-strike call option was trading yesterday for around $0.25, generating $25 in premium per contract for covered call sellers.
Selling the call option generates an income of 1.0% in 37 days, equalling around 9.7% annualized.
If the stock rises above the strike price of $27.50 at expiration, the return would be 7.7% which is 76.1% annualized.
The breakeven price is $25.53.
PFE is currently followed by 24 analysts with 6 Strong Buy ratings, 1 Moderate Buy rating, 16 Hold ratings and 1 Strong Sell rating.
The Barchart Technical Opinion rating is a 100% Buy with a Strengthening short term outlook on maintaining the current direction.
Long term indicators fully support a continuation of the trend.
The current IV Percentile is 10% which means that the current level of implied volatility is higher than just 10% of all occurrences in the last 12 months.
Please remember that options are risky, and investors can lose 100% of their investment. This article is for education purposes only and not a trade recommendation. Remember to always do your own due diligence and consult your financial advisor before making any investment decisions.
On the date of publication, Gavin McMaster did not have (either directly or indirectly) positions in any of the securities mentioned in this article. All information and data in this article is solely for informational purposes. For more information please view the Barchart Disclosure Policy here.
More news from Barchart


