ETFOptimize | High-performance ETF-based Investment Strategies

Quantitative strategies, Wall Street-caliber research, and insightful market analysis since 1998.


ETFOptimize | HOME
Close Window

How Is Eversource Energy Stock Performance Compared to Other Utility Stocks?

Eversource Energy (ES) is a leading utility company that engages in the generation, transmission, and distribution of electricity and natural gas, as well as regulated water services. The company, headquartered in Springfield, Massachusetts, operates through multiple segments, including Electric Distribution, Electric Transmission, Natural Gas Distribution, and Water Distribution. Eversource Energy has a market cap of around $25.4 billion.

Companies worth more than $10 billion are generally described as “large-cap” stocks, and Eversource Energy fits right into that category. The company distinguishes itself as a leader and serves more than 4.4 million customers.


ES is down 10.1% from its 52-week high of $75.25, reached on Oct. 28. Shares have gained 5.7% over the past three months, surpassing the State Street Utilities Select Sector SPDR ETF’s (XLU) marginal returns over the same time frame.   

www.barchart.com

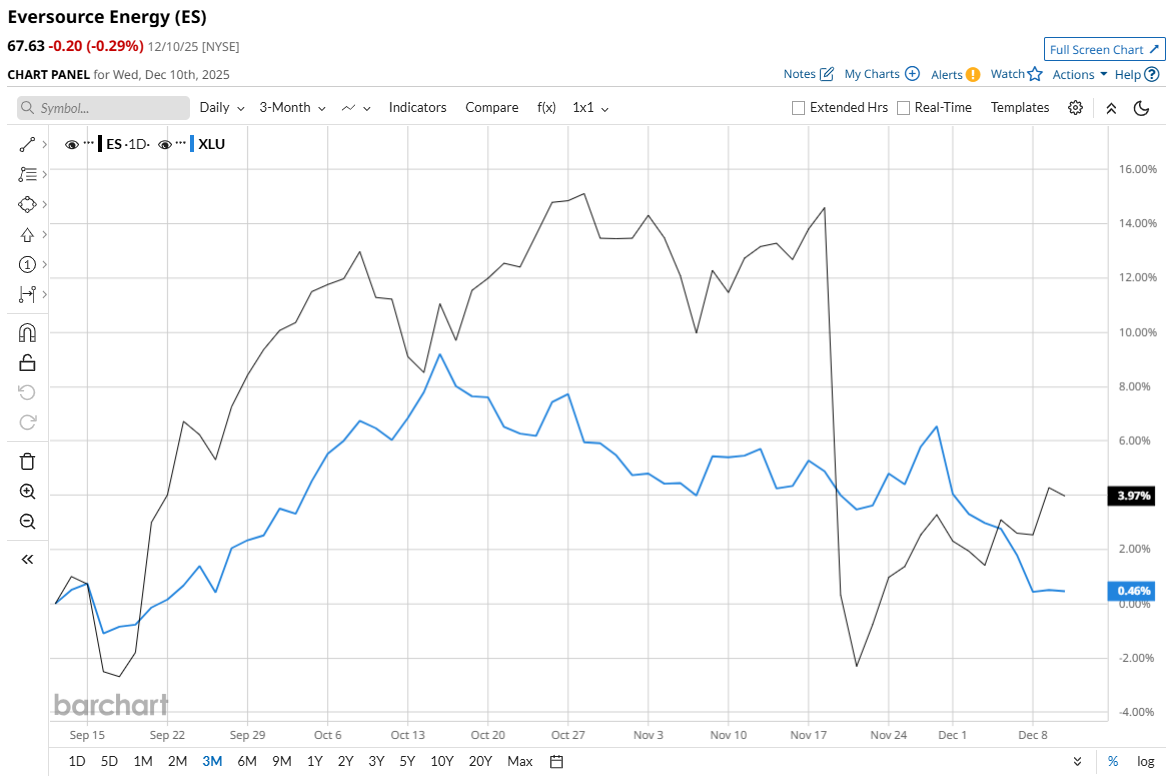
In the longer term, ES is up 17.8% on a YTD basis and 11.7% over the past 52 weeks, again outperforming XLU’s gains of 12.9% YTD and 9.4% over the past year. 

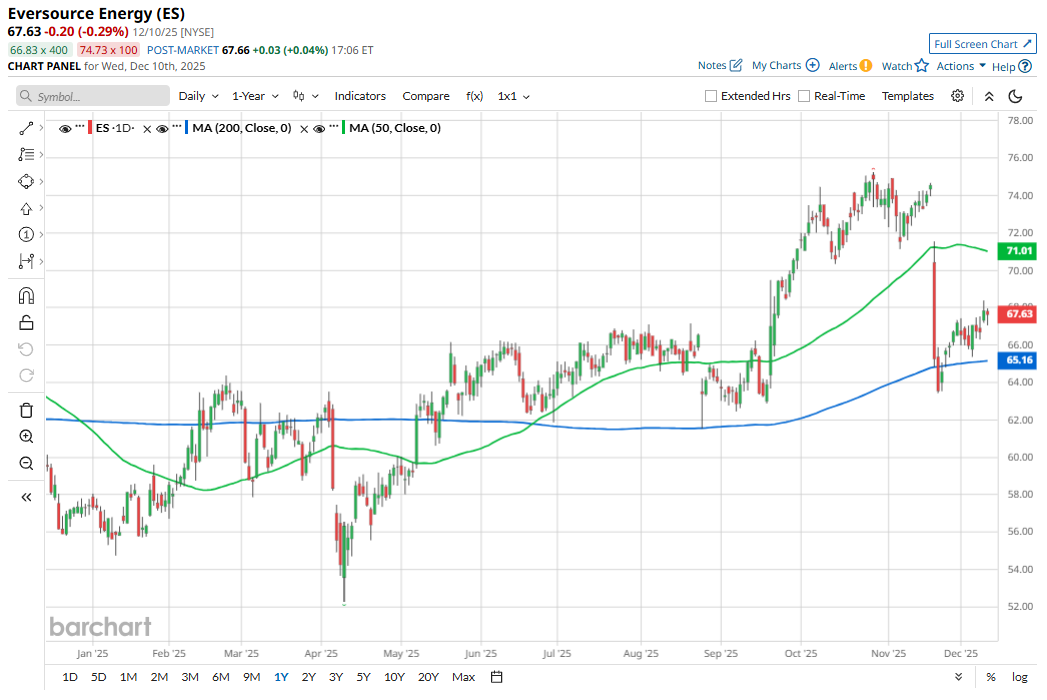
The stock has been trading mostly above the 200-day moving average since mid-May, except for some fluctuations lately. However, the stock is trading below the 50-day moving average since mid-November. 

www.barchart.com

The stock generally trended upward as the company returned to profitability after a prior net loss, with stronger earnings driven by its core regulated electric and gas businesses and infrastructure investments. Eversource reported a meaningful net income turnaround in Q3 2025 compared to 2024, which helped improve investor sentiment. The company reported earnings of $367.5 million, or $0.99 per share, for the third quarter of 2025, compared with a loss of $118.1 million, or $0.33 per share, in the prior-year quarter. 

However, the stock witnessed a significant plunge in mid-November after Connecticut regulators rejected the company’s proposed sale of its Aquarion water utility unit, a deal valued at over $2 billion, and investors reacted to the setback.

Nevertheless, ES has outperformed its rival, Edison International (EIX), which declined 28% YTD and 30.6% over the past year. 

However, the stock has a consensus rating of “Hold” from 17 analysts in coverage, and the mean price target of $72.78 suggests a 7.6% premium to its current levels. 


On the date of publication, Subhasree Kar did not have (either directly or indirectly) positions in any of the securities mentioned in this article. All information and data in this article is solely for informational purposes. For more information please view the Barchart Disclosure Policy here.


More news from Barchart

Recent Quotes

View More
Symbol Price Change (%)
AMZN  226.76
+5.49 (2.48%)
AAPL  272.19
+0.35 (0.13%)
AMD  201.06
+2.95 (1.49%)
BAC  54.26
-0.29 (-0.53%)
GOOG  303.75
+5.69 (1.91%)
META  664.45
+14.95 (2.30%)
MSFT  483.98
+7.86 (1.65%)
NVDA  174.14
+3.20 (1.87%)
ORCL  180.03
+1.57 (0.88%)
TSLA  483.37
+16.11 (3.45%)
Stock Quote API & Stock News API supplied by www.cloudquote.io
Quotes delayed at least 20 minutes.
By accessing this page, you agree to the Privacy Policy and Terms Of Service.


IntelligentValue Home
Close Window

DISCLAIMER

All content herein is issued solely for informational purposes and is not to be construed as an offer to sell or the solicitation of an offer to buy, nor should it be interpreted as a recommendation to buy, hold or sell (short or otherwise) any security.  All opinions, analyses, and information included herein are based on sources believed to be reliable, but no representation or warranty of any kind, expressed or implied, is made including but not limited to any representation or warranty concerning accuracy, completeness, correctness, timeliness or appropriateness. We undertake no obligation to update such opinions, analysis or information. You should independently verify all information contained on this website. Some information is based on analysis of past performance or hypothetical performance results, which have inherent limitations. We make no representation that any particular equity or strategy will or is likely to achieve profits or losses similar to those shown. Shareholders, employees, writers, contractors, and affiliates associated with ETFOptimize.com may have ownership positions in the securities that are mentioned. If you are not sure if ETFs, algorithmic investing, or a particular investment is right for you, you are urged to consult with a Registered Investment Advisor (RIA). Neither this website nor anyone associated with producing its content are Registered Investment Advisors, and no attempt is made herein to substitute for personalized, professional investment advice. Neither ETFOptimize.com, Global Alpha Investments, Inc., nor its employees, service providers, associates, or affiliates are responsible for any investment losses you may incur as a result of using the information provided herein. Remember that past investment returns may not be indicative of future returns.

Copyright © 1998-2017 ETFOptimize.com, a publication of Optimized Investments, Inc. All rights reserved.