ETFOptimize | High-performance ETF-based Investment Strategies

Quantitative strategies, Wall Street-caliber research, and insightful market analysis since 1998.


ETFOptimize | HOME
Close Window

How Is Teledyne Technologies' Stock Performance Compared to Other Technology Stocks?

Teledyne Technologies Incorporated (TDY), headquartered in Thousand Oaks, California, is a leading provider of sophisticated instrumentation. With a market cap of $24.1 billion, the company provides aerospace and defense electronics, digital imaging products and software, monitoring instrumentation for marine and environmental applications, harsh environment interconnect products, and subsystems for satellite communications. 

Companies worth $10 billion or more are generally described as “large-cap stocks,” and TDY fits right into that category with its market cap exceeding this threshold, reflecting its substantial size, influence, and dominance in the scientific & technical instruments industry. TDY's diversified product portfolio through strategic acquisition effectively enhances its technological capabilities and market reach. The company’s innovation and investment in R&D, global presence, and long-term contracts has enabled it to maintain a competitive edge over its peers.


Despite its notable strength, TDY slipped 13.4% from its 52-week high of $595.99, achieved on Oct. 7. Over the past three months, TDY stock declined 5.3%, underperforming the Technology Select Sector SPDR Fund’s (XLK10.1% gains during the same time frame.

www.barchart.com

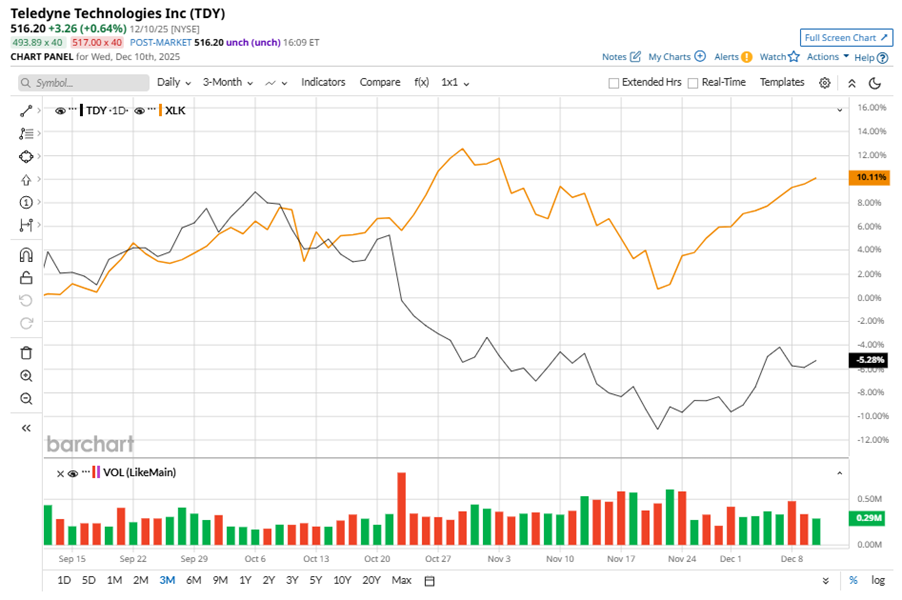
In the longer term, shares of TDY rose 3.1% on a six-month basis and climbed 9.6% over the past 52 weeks, underperforming XLK’s 23.5% gains on a six-month basis and 26.1% returns over the last year. 

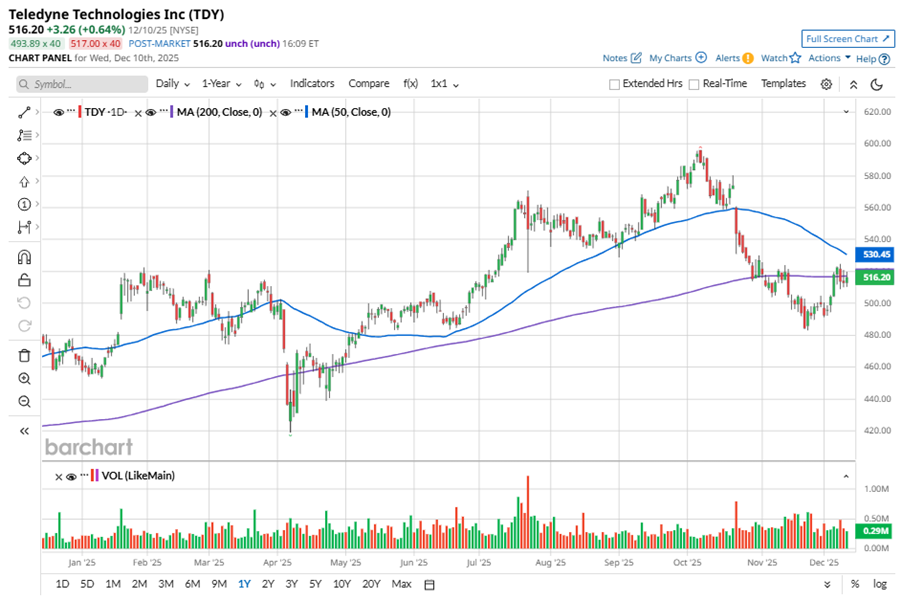
To confirm the bearish trend, TDY has been trading below its 200-day moving average since mid-November, with slight fluctuations. The stock has been trading below its 50-day moving average since late October.

www.barchart.com

On Oct. 22, TDY shares closed down more than 5% after reporting its Q3 results. Its adjusted EPS of $5.57 topped Wall Street expectations of $5.50. The company’s revenue was $1.54 billion, topping Wall Street forecasts of $1.52 billion. The company expects full-year adjusted EPS in the range of $21.45 to $21.60.

In the competitive arena of scientific & technical instruments, Keysight Technologies, Inc. (KEYS) has taken the lead over TDY, showing resilience with a 30.1% uptick on a six-month basis and 26% gains over the past 52 weeks.

Wall Street analysts are reasonably bullish on TDY’s prospects. The stock has a consensus “Moderate Buy” rating from the 11 analysts covering it, and the mean price target of $620.90 suggests a potential upside of 20.3% from current price levels.


On the date of publication, Neha Panjwani did not have (either directly or indirectly) positions in any of the securities mentioned in this article. All information and data in this article is solely for informational purposes. For more information please view the Barchart Disclosure Policy here.


More news from Barchart

Recent Quotes

View More
Symbol Price Change (%)
AMZN  226.76
+5.49 (2.48%)
AAPL  272.19
+0.35 (0.13%)
AMD  201.06
+2.95 (1.49%)
BAC  54.26
-0.29 (-0.53%)
GOOG  303.75
+5.69 (1.91%)
META  664.45
+14.95 (2.30%)
MSFT  483.98
+7.86 (1.65%)
NVDA  174.14
+3.20 (1.87%)
ORCL  180.03
+1.57 (0.88%)
TSLA  483.37
+16.11 (3.45%)
Stock Quote API & Stock News API supplied by www.cloudquote.io
Quotes delayed at least 20 minutes.
By accessing this page, you agree to the Privacy Policy and Terms Of Service.


IntelligentValue Home
Close Window

DISCLAIMER

All content herein is issued solely for informational purposes and is not to be construed as an offer to sell or the solicitation of an offer to buy, nor should it be interpreted as a recommendation to buy, hold or sell (short or otherwise) any security.  All opinions, analyses, and information included herein are based on sources believed to be reliable, but no representation or warranty of any kind, expressed or implied, is made including but not limited to any representation or warranty concerning accuracy, completeness, correctness, timeliness or appropriateness. We undertake no obligation to update such opinions, analysis or information. You should independently verify all information contained on this website. Some information is based on analysis of past performance or hypothetical performance results, which have inherent limitations. We make no representation that any particular equity or strategy will or is likely to achieve profits or losses similar to those shown. Shareholders, employees, writers, contractors, and affiliates associated with ETFOptimize.com may have ownership positions in the securities that are mentioned. If you are not sure if ETFs, algorithmic investing, or a particular investment is right for you, you are urged to consult with a Registered Investment Advisor (RIA). Neither this website nor anyone associated with producing its content are Registered Investment Advisors, and no attempt is made herein to substitute for personalized, professional investment advice. Neither ETFOptimize.com, Global Alpha Investments, Inc., nor its employees, service providers, associates, or affiliates are responsible for any investment losses you may incur as a result of using the information provided herein. Remember that past investment returns may not be indicative of future returns.

Copyright © 1998-2017 ETFOptimize.com, a publication of Optimized Investments, Inc. All rights reserved.