Saint Louis, Missouri-based Ameren Corporation (AEE) generates and distributes electricity and natural gas to residential, commercial, industrial, and wholesale end markets in Missouri and Illinois. With a market cap of $26.6 billion, Ameren operates through Ameren Missouri, Ameren Illinois Electric Distribution, Ameren Illinois Natural Gas, and Ameren Transmission segments.
Companies with a market cap of $10 billion or more are categorized as "large-cap stocks." Ameren fits this description perfectly, with its market cap exceeding this threshold, reflecting its substantial size and influence in the utility sector.
Ameren touched its all-time high of $106.73 on Oct. 20 and is currently trading 8.4% below that peak. Meanwhile, the stock has declined 1.5% over the past three months, notably underperforming the Dow Jones Industrial Average’s ($DOWI) 5.6% uptick during the same time frame.
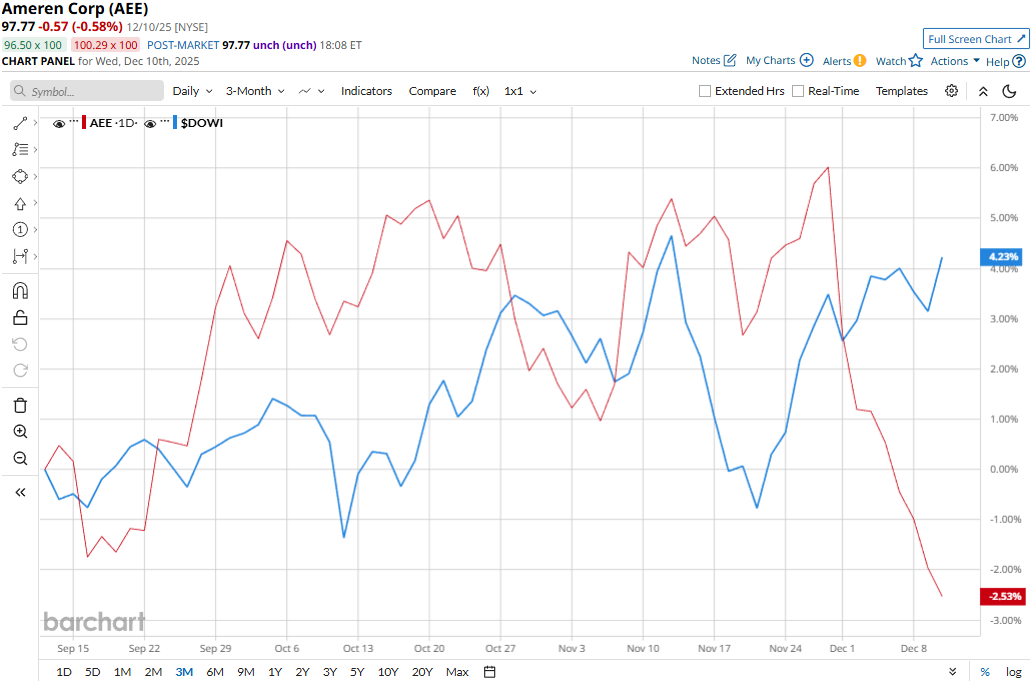
Ameren has slightly lagged behind the Dow over the longer term as well. AEE stock prices have gained 9.7% on a YTD basis and 7.2% over the past 52 weeks, compared to the Dow’s 13% surge in 2025 and 8.6% returns over the past year.
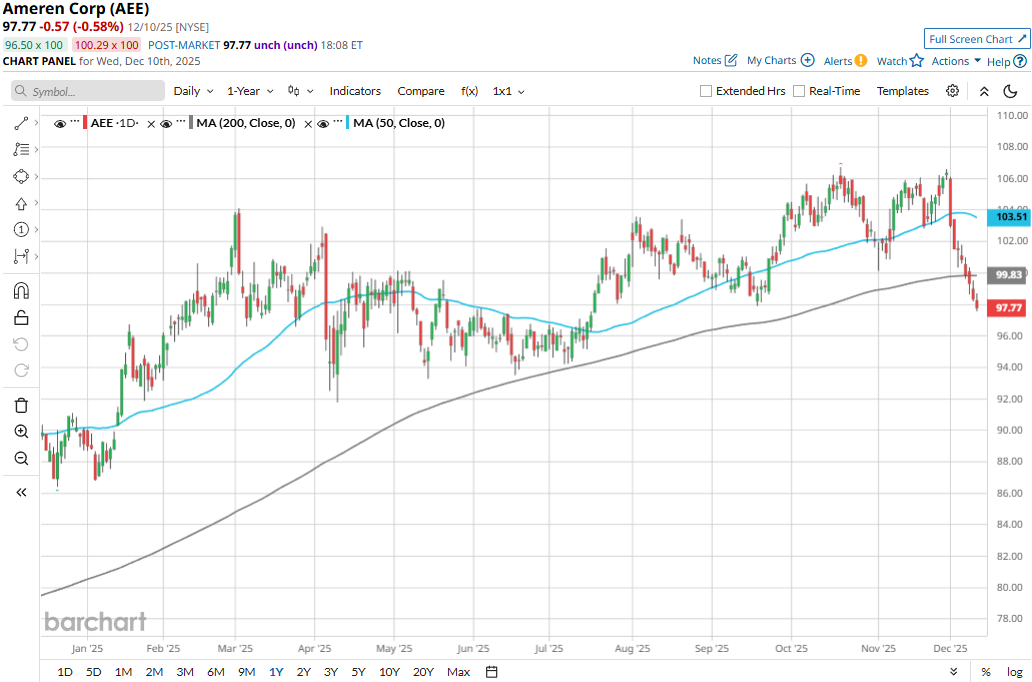
AEE stock traded consistently above the 200-day moving average over the past year until the last week and dropped below its 50-day moving average in early December, underscoring its overall bullish trend and recent downturn.
Ameren’s stock prices observed a marginal uptick in the trading session following the release of its better-than-expected Q3 results on Nov. 5. Driven by a solid surge in electric revenues, the company’s overall topline for the quarter soared 24.2% year-over-year to $2.7 billion, exceeding the Street’s expectations by a significant margin. Meanwhile, its adjusted EPS also increased by a notable 16% year-over-year to $2.17, surpassing the consensus estimates by 3.3%.
Meanwhile, Ameren has notably outpaced its peer, Consolidated Edison, Inc.’s (ED) 6.9% gains on a YTD basis and a marginal 76 bps uptick over the past 52 weeks.
Among the 14 analysts covering the AEE stock, the consensus rating is a “Moderate Buy.” As of writing, its mean price target of $113.69 suggests a 16.3% upside potential from current price levels.
On the date of publication, Aditya Sarawgi did not have (either directly or indirectly) positions in any of the securities mentioned in this article. All information and data in this article is solely for informational purposes. For more information please view the Barchart Disclosure Policy here.
More news from Barchart
- Jamie Dimon Has Long Been Sounding the Economic Alarm. After the Fed’s Latest Rate Cut, Can You Still Bank on JPMorgan Stock?
- Unlock Over 7% Income: Analysts Love These 2 High-Yield Dividend Stocks
- Nearly 45% of Its Float Is Being Sold Short. Should You Bet on iRobot Stock Here?
- Eric Jackson Could Make Nextdoor the Next Big Meme Stock. Should You Chase the Rally Here?