ETFOptimize | High-performance ETF-based Investment Strategies

Quantitative strategies, Wall Street-caliber research, and insightful market analysis since 1998.


ETFOptimize | HOME
Close Window

Is Principal Financial Stock Underperforming the Nasdaq?

Des Moines, Iowa-based Principal Financial Group, Inc. (PFG), is a leading global financial services provider that offers a wide range of financial products and services to individuals, corporations, and institutional clients. With a market cap of $19.7 billion, the company offers retirement solutions, life and health insurance, wellness programs, and investment and banking products.

Companies worth $10 billion or more are generally described as “large-cap stocks,” and PFG perfectly fits that description, with its market cap exceeding this mark, underscoring its size, influence, and dominance within the asset management industry. PFG's strengths include its diversified portfolio, scale, and brand equity. Its interconnected business units drive revenue and strengthen each other. The company's scale enables tech and talent investments, while its brand attracts and retains customers. PFG’s digital platforms and data analytics also personalize experiences, streamline operations, and provide market insights, creating a competitive edge.


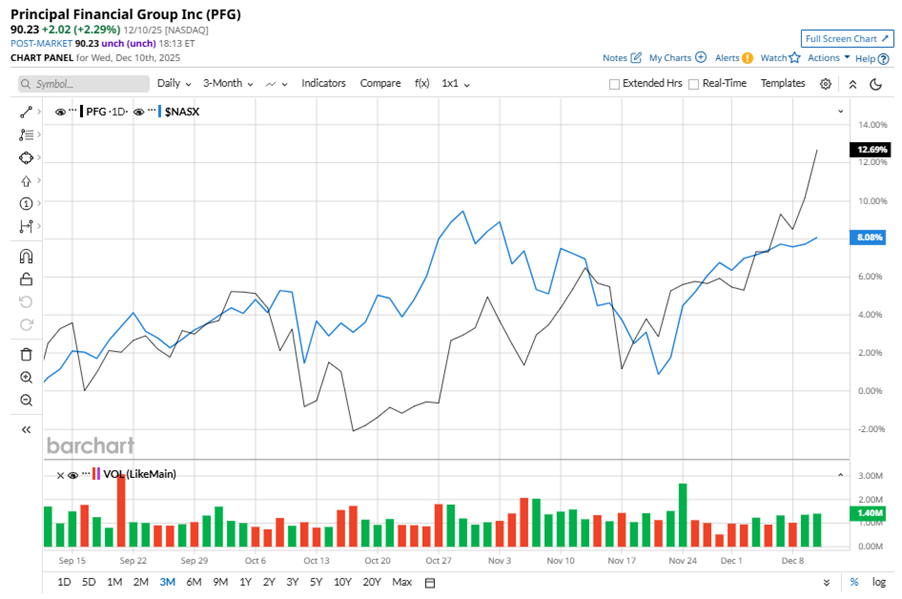
Despite its notable strength, PFG shares touched their 52-week high of $90.63 in the last trading session. Over the past three months, PFG stock has surged 12.7%, outperforming the Nasdaq Composite’s ($NASX) 8.1% gains during the same time frame.

www.barchart.com

In the longer term, shares of PFG rose 17.6% on a six-month basis and climbed 11.8% over the past 52 weeks, underperforming NASX’s six-month gains of 20% and solid 20.2% returns over the last year.

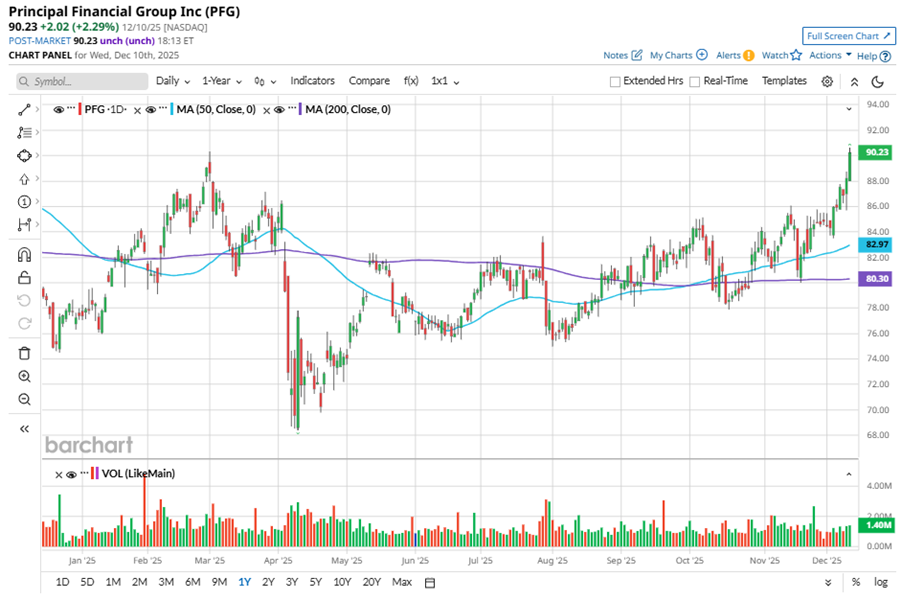
To confirm the bullish trend, PFG has been trading above its 50-day and 200-day moving averages since late August, with slight fluctuations.

www.barchart.com

On Oct. 27, PFG reported its Q3 results, and its shares closed up more than 3% in the following trading session. Its adjusted EPS of $2.10 did not meet Wall Street expectations of $2.18. The company’s adjusted revenue was $3.9 billion, missing Wall Street forecasts of $4.1 billion.

PFG’s rival, Corebridge Financial, Inc. (CRBG), has lagged behind the stock, with a 5.5% dip on a six-month basis and 3.5% returns over the past 52 weeks.

Wall Street analysts are cautious on PFG’s prospects. The stock has a consensus “Hold” rating from the 15 analysts covering it. While PFG currently trades above its mean price target of $88.85, the Street-high price target of $103 suggests a 14.2% upside potential.


On the date of publication, Neha Panjwani did not have (either directly or indirectly) positions in any of the securities mentioned in this article. All information and data in this article is solely for informational purposes. For more information please view the Barchart Disclosure Policy here.


More news from Barchart

Recent Quotes

View More
Symbol Price Change (%)
AMZN  226.76
+5.49 (2.48%)
AAPL  272.19
+0.35 (0.13%)
AMD  201.06
+2.95 (1.49%)
BAC  54.26
-0.29 (-0.53%)
GOOG  303.75
+5.69 (1.91%)
META  664.45
+14.95 (2.30%)
MSFT  483.98
+7.86 (1.65%)
NVDA  174.14
+3.20 (1.87%)
ORCL  180.03
+1.57 (0.88%)
TSLA  483.37
+16.11 (3.45%)
Stock Quote API & Stock News API supplied by www.cloudquote.io
Quotes delayed at least 20 minutes.
By accessing this page, you agree to the Privacy Policy and Terms Of Service.


IntelligentValue Home
Close Window

DISCLAIMER

All content herein is issued solely for informational purposes and is not to be construed as an offer to sell or the solicitation of an offer to buy, nor should it be interpreted as a recommendation to buy, hold or sell (short or otherwise) any security.  All opinions, analyses, and information included herein are based on sources believed to be reliable, but no representation or warranty of any kind, expressed or implied, is made including but not limited to any representation or warranty concerning accuracy, completeness, correctness, timeliness or appropriateness. We undertake no obligation to update such opinions, analysis or information. You should independently verify all information contained on this website. Some information is based on analysis of past performance or hypothetical performance results, which have inherent limitations. We make no representation that any particular equity or strategy will or is likely to achieve profits or losses similar to those shown. Shareholders, employees, writers, contractors, and affiliates associated with ETFOptimize.com may have ownership positions in the securities that are mentioned. If you are not sure if ETFs, algorithmic investing, or a particular investment is right for you, you are urged to consult with a Registered Investment Advisor (RIA). Neither this website nor anyone associated with producing its content are Registered Investment Advisors, and no attempt is made herein to substitute for personalized, professional investment advice. Neither ETFOptimize.com, Global Alpha Investments, Inc., nor its employees, service providers, associates, or affiliates are responsible for any investment losses you may incur as a result of using the information provided herein. Remember that past investment returns may not be indicative of future returns.

Copyright © 1998-2017 ETFOptimize.com, a publication of Optimized Investments, Inc. All rights reserved.