Tuesday was not just the day before the Federal Reserve announced its latest rate cut. It was also the day that the leader of U.S. bank stocks dropped like a rock.
JPMorgan (JPM) fell by 4.66% on the day, after the CEO of its Consumer & Community Banking unit startled traders by explaining that its expenses are likely to rise next year. The culprits: inflation and competition. The result? A lot of lost market cap.
One has to wonder if the concerns about the broader economy and market conditions expressed by CEO Jamie Dimon are starting to hit home.
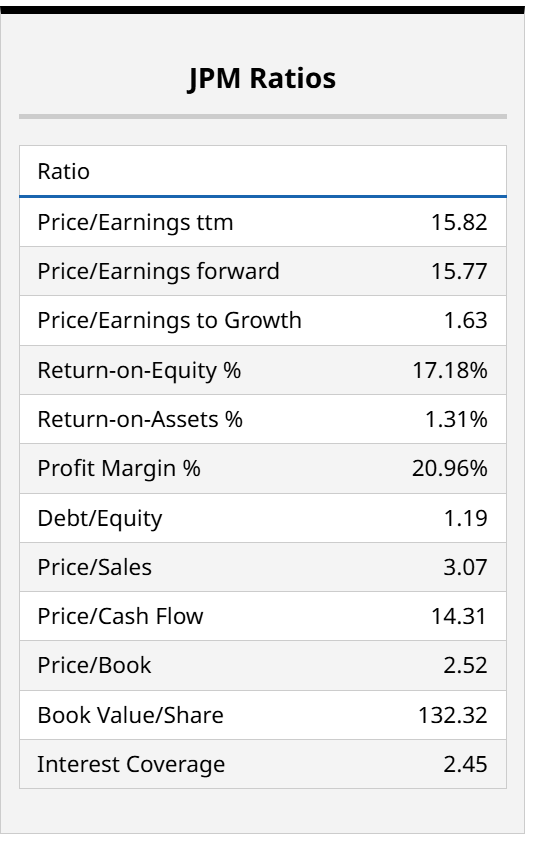
JPM still trades at a reasonable valuation, at under 16x trailing and forward earnings. And it has been almost like a backup government entity at times of crisis, such as in 2008 and again during the more recent regional bank crisis a few years ago. But is its own house in order?
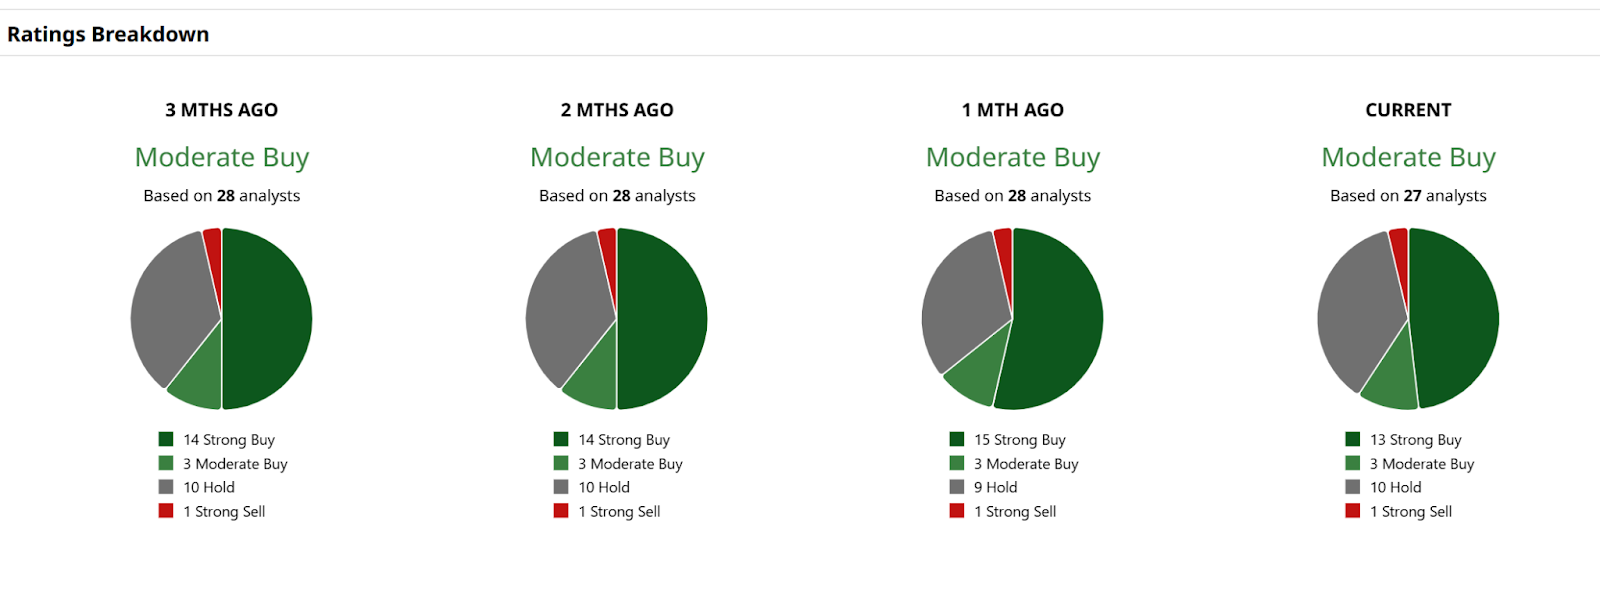
Wall Street analysts tend to think so. “Strong Buy” ratings dominate, and have for a while. However, I personally take those grades with a grain of salt. They tend to be cheerleaders and front-runners, and only as good as a bull market. We’ll put that to the test in just about a month, when JPM again acts as a sort of leadoff hitter for earnings season.
What Does JPM’s Chart Say?
The daily looks a lot like many other large cap stocks I track. That is, rangebound. Or, more bluntly, very boring and not the stuff of which confident decisions can currently be made. But with the Fed rate cut announced Wednesday, and likely days of follow-on reaction to come, we might get a clue soon.
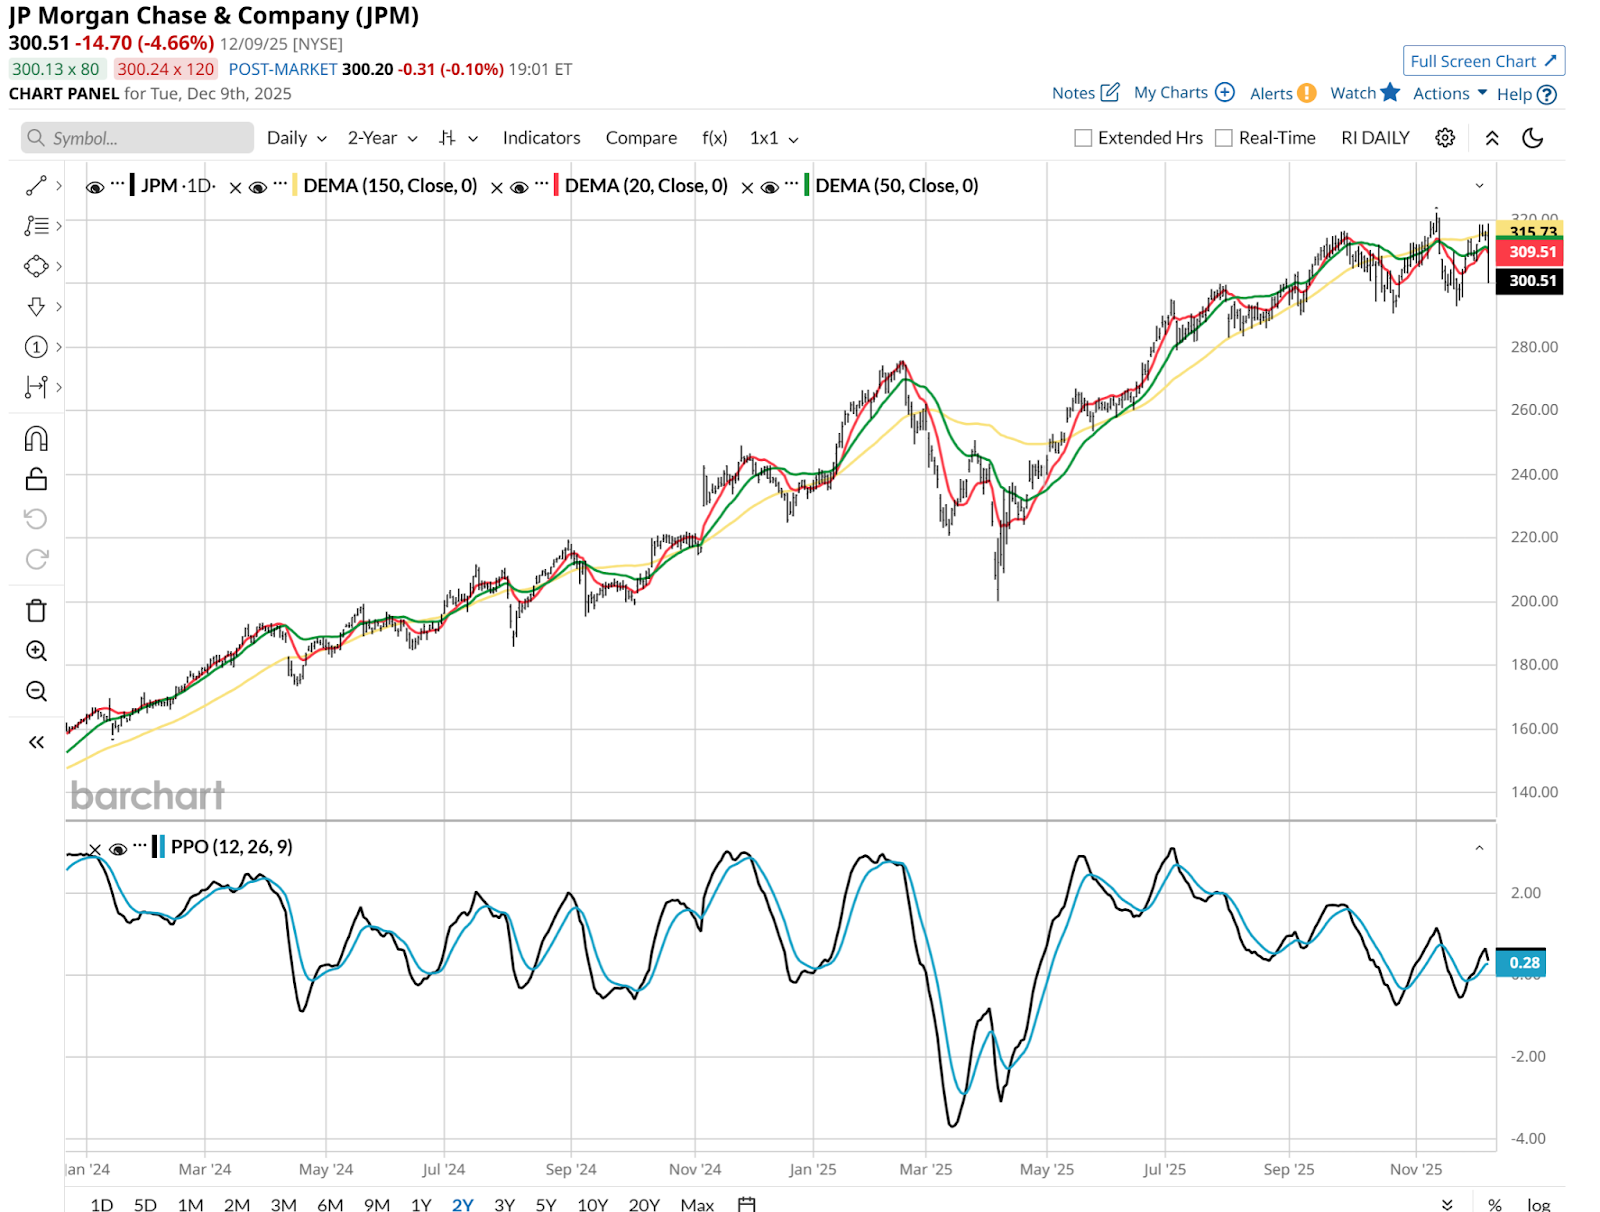
After all, at stake is the next major bend in the yield curve. That is, while we know rates are more likely to come down in the intermediate term than go up, the longer-term part of the bond market is still very much up for grabs.
Which Way Will Rates Go After the Fed Meeting?
A tug of war exists between the case for higher rates (U.S. debt is too high and not being dealt with, plus lingering inflation) and lower rates (recession concerns and flight to quality). JPM, as a systemically important bank, is likely a beneficiary of higher long-term rates. Because it can lend at higher rates while short-term borrowing costs from the Fed drop.
On to the weekly chart, we see what to me is a much more defined reward/risk tradeoff. Why? Because the Percentage Price Oscillator (PPO) at the bottom of the chart has rolled over. And it appears to be leaking downward. That leads me to believe that the odds tilt toward lower prices in the months ahead, regardless of what the near-term, post-Fed reaction is.
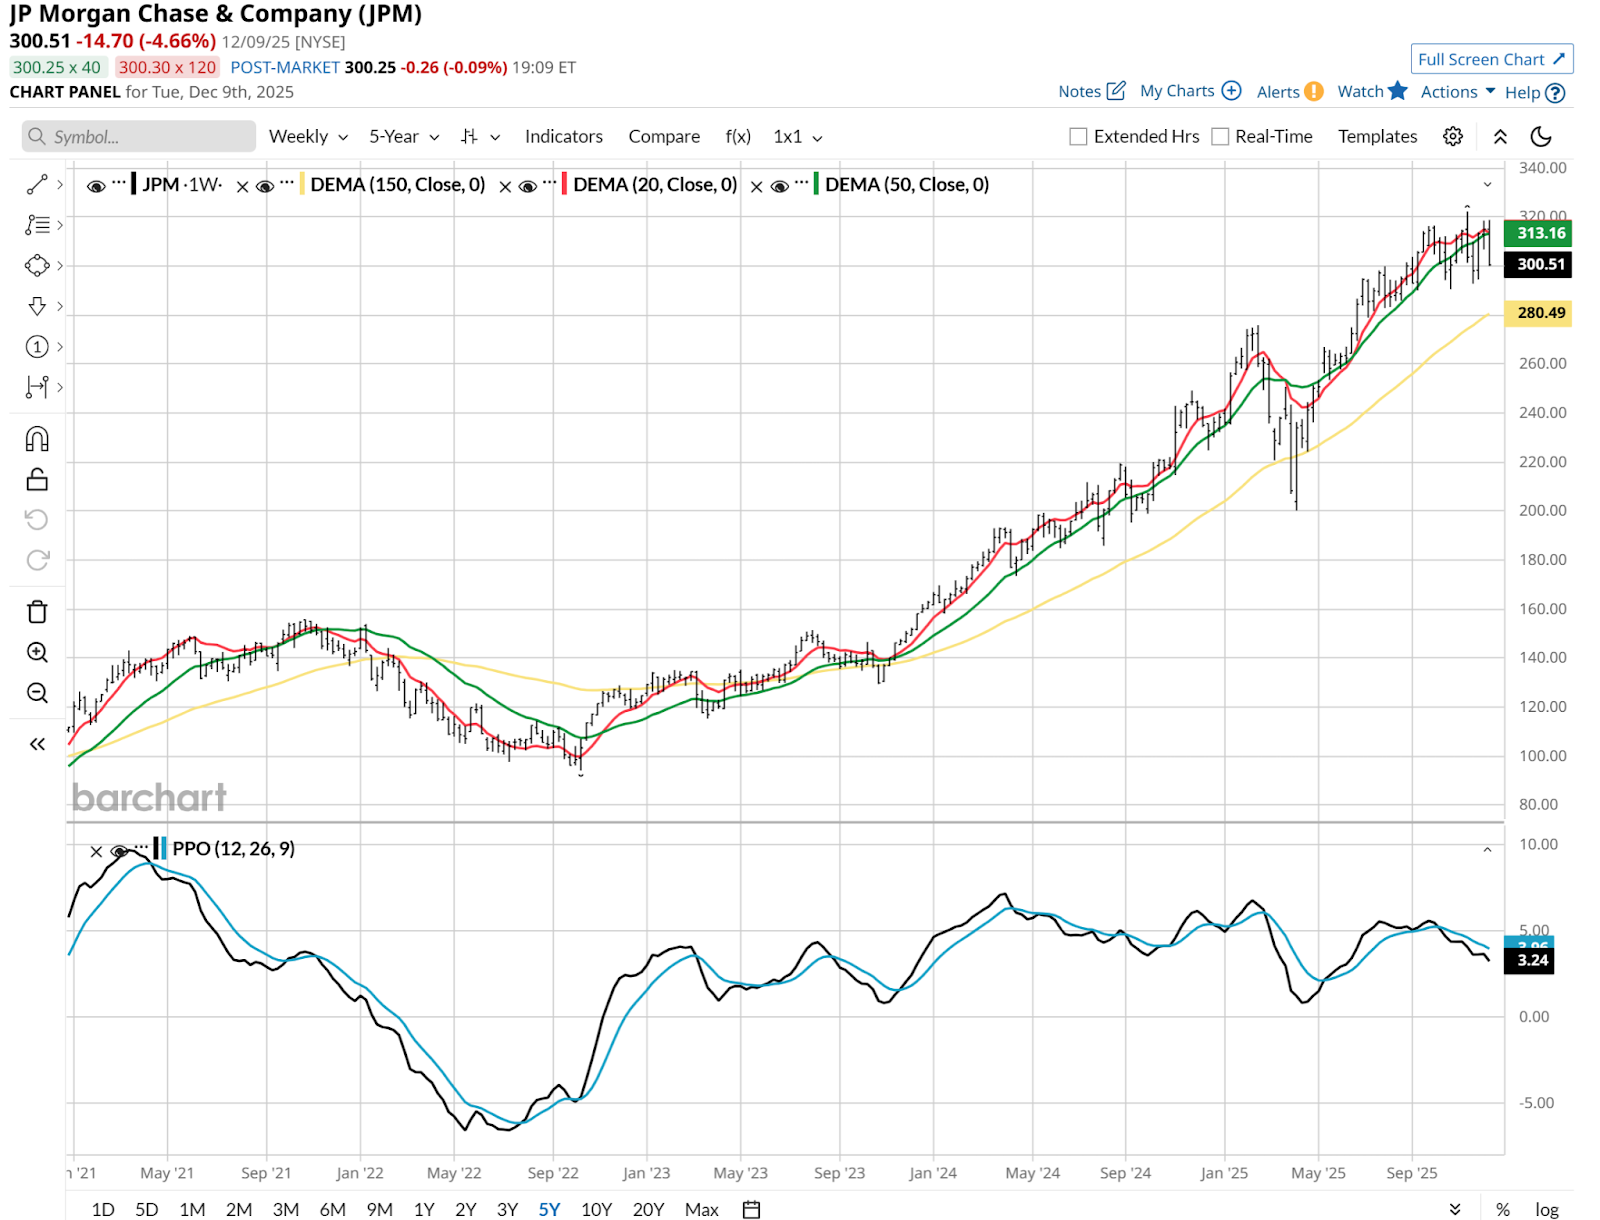
Also note that the nearly 5% dip in the stock on Tuesday is indistinguishable in the weekly chart. That’s a good thing as I see it. It tells me that such a one-day move is simply another brick in the wall of worry for JPM stock. As such, caution is the key.
Still, every stock picture has two sides. And so to state the bull chart case, see the PPO from the summer of 2024 in that same weekly view. It sure looks a lot like the current pattern. What happened to JPM stock during that time? A more than 10% rally ensued.
Conclusion: This stock is one to watch, not only for its price action, but as a barometer of the broader economy.
Rob Isbitts, founder of Sungarden Investment Publishing, is a semi-retired chief investment officer, whose current research is found here at Barchart, and at his ETF Yourself subscription service on Substack. To copy-trade Rob’s portfolios, check out the new Pi Trade app.
On the date of publication, Rob Isbitts did not have (either directly or indirectly) positions in any of the securities mentioned in this article. All information and data in this article is solely for informational purposes. For more information please view the Barchart Disclosure Policy here.
More news from Barchart
- Jamie Dimon Has Long Been Sounding the Economic Alarm. After the Fed’s Latest Rate Cut, Can You Still Bank on JPMorgan Stock?
- Unlock Over 7% Income: Analysts Love These 2 High-Yield Dividend Stocks
- Nearly 45% of Its Float Is Being Sold Short. Should You Bet on iRobot Stock Here?
- Eric Jackson Could Make Nextdoor the Next Big Meme Stock. Should You Chase the Rally Here?


