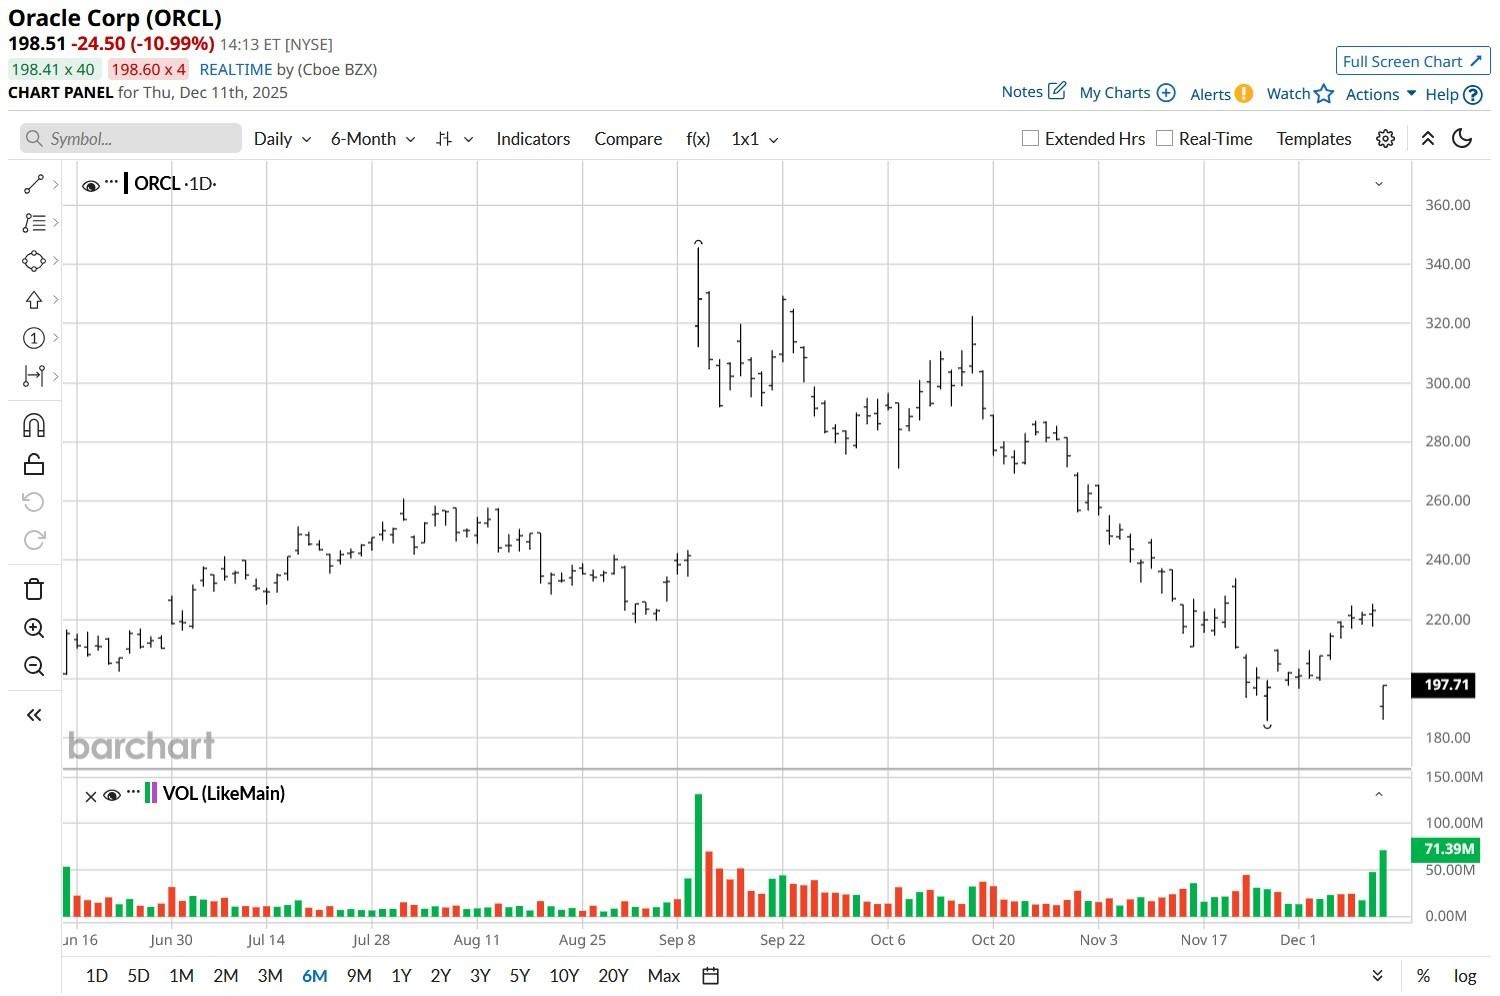
Oracle (ORCL) stock tanked as much as 15% on Dec. 11 after the company raised its guidance for artificial intelligence (AI) spending, even as revenue missed estimates in Q2.
The selloff, its largest since January, even pushed ORCL decisively below its longer-term 200-day moving average, reinforcing bearish momentum heading into 2026.
Following the post-earnings decline, Oracle stock is down roughly 40% versus its September high.
Why Is the Capex Guide Concerning for Oracle Stock?
Oracle’s rising capital expenditures despite weaker-than-expected top-line growth are concerning, not just for the company’s shareholders, but for the broader AI ecosystem as well.
The NYSE-listed giant plans on spending up to $50 billion on artificial intelligence by May 2026, yet its second-quarter revenue came in about $150 million shy of experts’ forecast.
This mismatch between capex and sales growth suggests bubble-like behavior. What it signals is that the multinational is chasing AI momentum at any cost.
However, if artificial intelligence demand normalizes, or if it doesn’t scale as rapidly as expected, ORCL shares may end up tumbling further next year.
ORCL Shares Still Aren’t Inexpensive to Own
The bubble concerns are especially relevant for Oracle shares given the Austin-headquartered firm is more leveraged currently than the likes of Google (GOOGL), Microsoft (MSFT), and Amazon (AMZN).
As of writing, Oracle has over $100 billion in debt, a number that may only grow further in 2026 as it continues to finance its AI ambitions.
Meanwhile, the technical landscape isn’t particularly inspiring for this legacy technology company either. At north of 47, its long-term relative strength index (100-day) doesn’t suggest the downward momentum will exhaust in the near term.
Importantly, even after the massive selloff in recent months, ORCL is going for about 41x forward earnings, which isn’t cheap for a business that’s failing to meet analysts’ expectations for revenue growth.
Wall Street Remains Bullish on Oracle
Despite the aforementioned concerns, Wall Street refused to throw in the towel on Oracle shares.
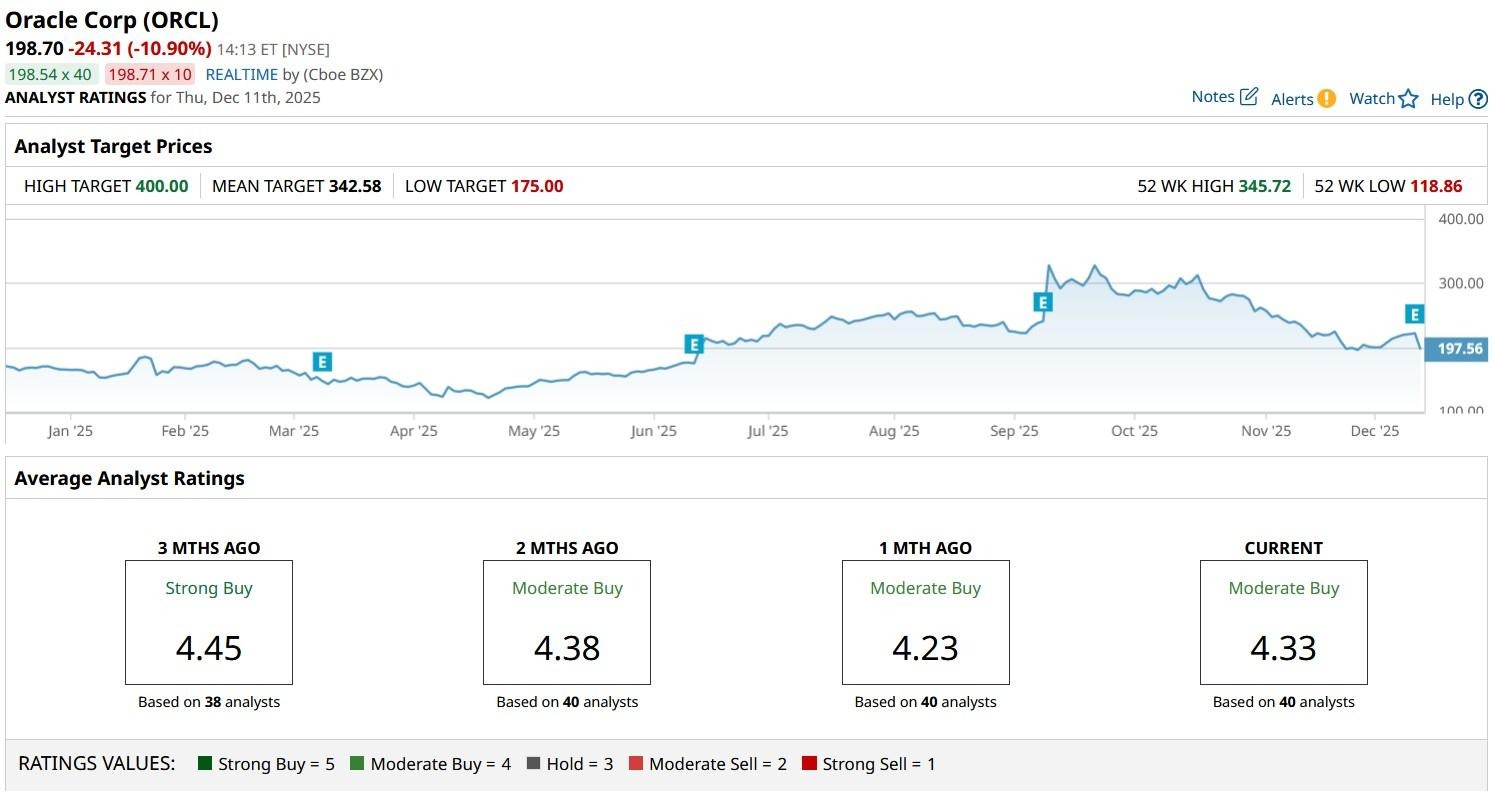
According to Barchart, the consensus rating on ORCL stock remains at “Moderate Buy” with the mean target of about $342 indicating potential upside of roughly 80% from current levels.
On the date of publication, Wajeeh Khan did not have (either directly or indirectly) positions in any of the securities mentioned in this article. All information and data in this article is solely for informational purposes. For more information please view the Barchart Disclosure Policy here.
More news from Barchart
- Rivian’s Autonomy & AI Day Failed to Move the Needle for RIVN Stock. How Should You Play It Here?
- Intel Is Reportedly Buying SambaNova Systems. What Does That Mean for INTC Stock?
- GameStop Just Beat Earnings Estimates. Should You Bet on a Turnaround in GME Stock?
- Should You Buy Micron Before December 17? These Analysts Think So.


