ETFOptimize | High-performance ETF-based Investment Strategies

Quantitative strategies, Wall Street-caliber research, and insightful market analysis since 1998.


ETFOptimize | HOME
Close Window

Tyson Foods Stock: Is TSN Underperforming the Consumer Staples Sector?

Tyson Foods, Inc. (TSN), based in Springdale, Arkansas, operates a global protein empire through its Beef, Pork, Chicken, and Prepared Foods segments. It processes cattle, hogs, and chickens into fresh, frozen, and value-added products, managing iconic brands like Tyson, Jimmy Dean, Hillshire Farm, and Ball Park.

The company holds a market capitalization of around $20.4 billion, which firmly places it in the “large-cap” category, as companies valued above $10 billion earn that distinction. This scale underscores Tyson’s size, influence, and dominance, strengthening its ability to market its products across retail, foodservice, and industrial customers.


Tyson's shares currently trade about 10.4% below their April high of $64.36, yet the stock has gained nearly 4.1% over the past three months, outperforming the 2.2% plunge in the State Street Consumer Staples Select Sector SPDR ETF (XLP).

www.barchart.com

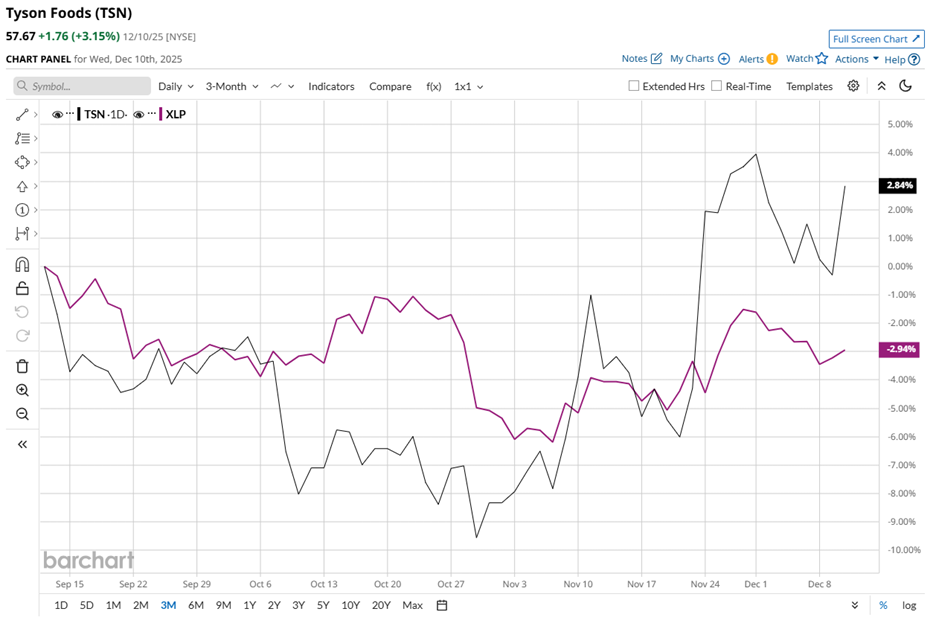
Over the past 52 weeks, TSN stock has plunged 7.6%, while year-to-date (YTD), it remains only marginally positive, highlighting a gradual but directionally positive recovery. Meanwhile, XLP has plummeted 5.4% over the same 52-week period and declined marginally YTD. 

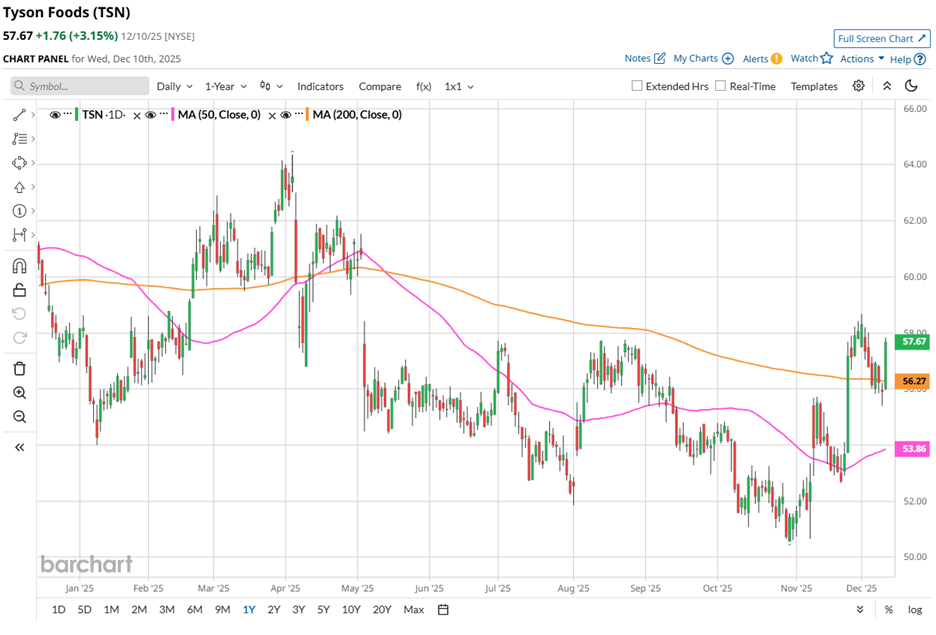
Technical strength also remains sound. Since late Nov, TSN has traded above its 50-day moving average of $53.86 and its 200-day moving average of $56.27, breaking below these levels only briefly in Dec before regaining pace. 

www.barchart.com

On Nov. 21, Tyson Foods announced network adjustments to streamline its beef operations and enhance long-term efficiency by shutting down its Lexington, Nebraska, facility and converting Amarillo, Texas, to a single, full-capacity shift, while increasing production at other plants to optimize volumes across the network. 

The market reacted positively as TSN stock rose 1.8% on the announcement and then gained 6.5% on Nov. 24, as investors interpreted the Lexington closure as a strategic move to enhance both capacity and margins.

For context, TSN’s rival, Archer-Daniels-Midland Company (ADM), has gained 11.8% over the past 52 weeks and risen 15.2% YTD, indicating that while TSN demonstrates resilience, it has room to catch up with top-performing peers.

Even with recent operational adjustments and a sound technical footing, analysts maintain a measured outlook, signaling cautious optimism regarding the stock’s prospects. TSN is carrying a “Hold” consensus rating from 10 analysts, with a mean price target of $61.20, signaling a premium of 6.1% to current levels.


On the date of publication, Aanchal Sugandh did not have (either directly or indirectly) positions in any of the securities mentioned in this article. All information and data in this article is solely for informational purposes. For more information please view the Barchart Disclosure Policy here.


More news from Barchart

Recent Quotes

View More
Symbol Price Change (%)
AMZN  226.76
+0.00 (0.00%)
AAPL  272.19
+0.00 (0.00%)
AMD  201.06
+0.00 (0.00%)
BAC  54.26
+0.00 (0.00%)
GOOG  303.75
+0.00 (0.00%)
META  664.45
+0.00 (0.00%)
MSFT  483.98
+0.00 (0.00%)
NVDA  174.14
+0.00 (0.00%)
ORCL  180.03
+0.00 (0.00%)
TSLA  483.37
+0.00 (0.00%)
Stock Quote API & Stock News API supplied by www.cloudquote.io
Quotes delayed at least 20 minutes.
By accessing this page, you agree to the Privacy Policy and Terms Of Service.


IntelligentValue Home
Close Window

DISCLAIMER

All content herein is issued solely for informational purposes and is not to be construed as an offer to sell or the solicitation of an offer to buy, nor should it be interpreted as a recommendation to buy, hold or sell (short or otherwise) any security.  All opinions, analyses, and information included herein are based on sources believed to be reliable, but no representation or warranty of any kind, expressed or implied, is made including but not limited to any representation or warranty concerning accuracy, completeness, correctness, timeliness or appropriateness. We undertake no obligation to update such opinions, analysis or information. You should independently verify all information contained on this website. Some information is based on analysis of past performance or hypothetical performance results, which have inherent limitations. We make no representation that any particular equity or strategy will or is likely to achieve profits or losses similar to those shown. Shareholders, employees, writers, contractors, and affiliates associated with ETFOptimize.com may have ownership positions in the securities that are mentioned. If you are not sure if ETFs, algorithmic investing, or a particular investment is right for you, you are urged to consult with a Registered Investment Advisor (RIA). Neither this website nor anyone associated with producing its content are Registered Investment Advisors, and no attempt is made herein to substitute for personalized, professional investment advice. Neither ETFOptimize.com, Global Alpha Investments, Inc., nor its employees, service providers, associates, or affiliates are responsible for any investment losses you may incur as a result of using the information provided herein. Remember that past investment returns may not be indicative of future returns.

Copyright © 1998-2017 ETFOptimize.com, a publication of Optimized Investments, Inc. All rights reserved.